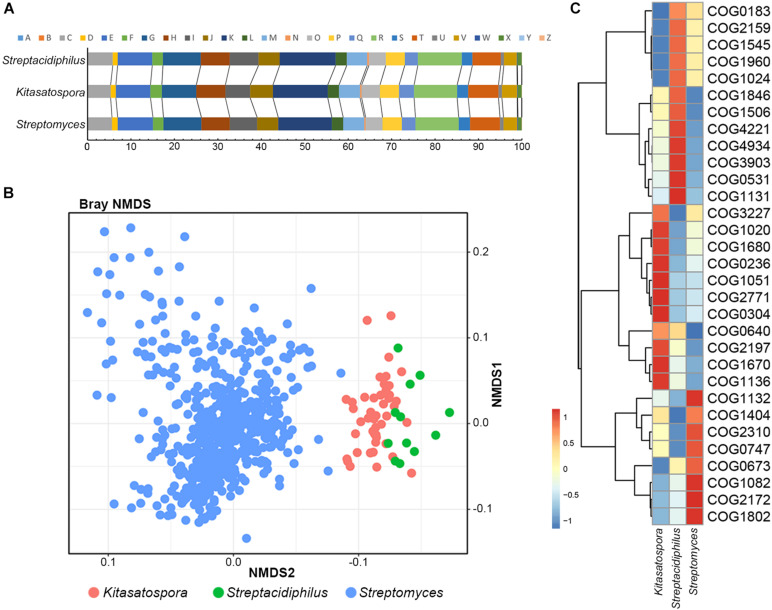
FIGURE 2.
Correlation and divergence of functional traits between genera. (A) Stack bar chart showing functional proportions of genes based on COG categories. (B) Non-metric multidimensional scaling (NMDS) plot of COGs showing distinct clustering of each genus. (C) Heatmap of COGs that significantly contributed most to the dissimilarity between different genera. Relative abundance of the COGs is presented after transformation with a z-score.

