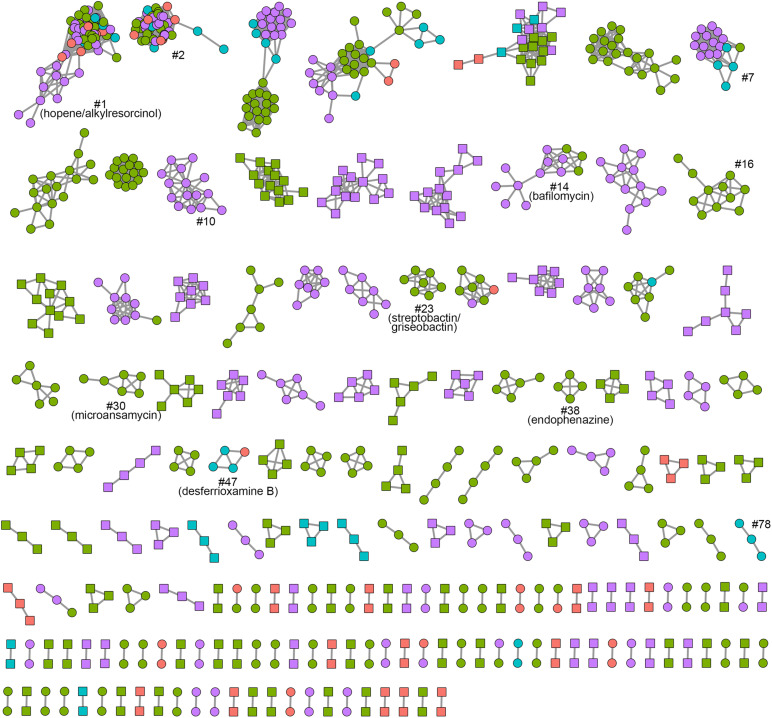
FIGURE 6.
BiG-SCAPE sequence similarity network of Kitasatospora. Each node represents one BGC identified by antiSMASH. Colors represent lineages I to IV (red, Lineage I; green, Lineage II; cyan, Lineage III; purple, Lineage IV). Kitasatospora-specific BGCs are highlighted with square node. BGCs discussed in this work are marked.

