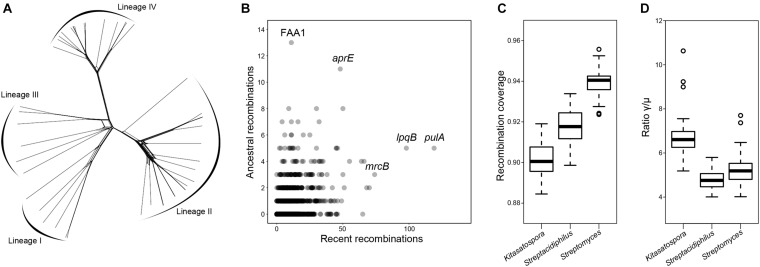
FIGURE 7.
Extensive recombination in Kitasatospora. (A) Phylogenetic network inferred with the concatenation of single-copy core genes. Lines between splits show where recombination has occurred. (B) Core genes that have undergone recent and ancestral recombination. Horizontal and vertical axes show the estimated number of recent and ancestral recombinations, respectively. Names of some of the most frequently recombined genes are shown. (C,D) Comparison of the recombination coverage and the ratio γ/μ between genera, respectively. These two parameters were calculated from 50 subsets each containing 50 different species (pairwise ANI < 95%; 20 for genus Kitasatospora, 20 for genus Streptomyces, and 10 for genus Streptacidiphilus) randomly selected from the genome dataset. The boxplot shows the median, and the first and third quartiles as the lower and upper hinges. Outliers are indicated as dots. All values are significantly positive (p < 0.001, paired two-tailed Student’s t-test).

