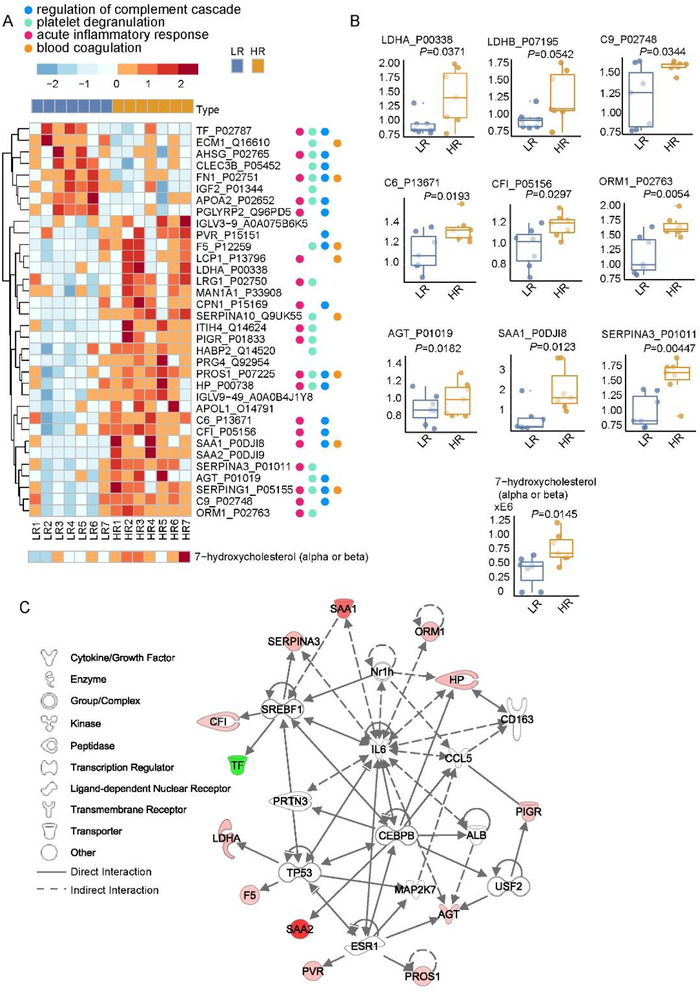
FIGURE 2.

Molecular differences between low‐ and high‐risk patients. (A) Heatmap of 34 differentially expressed proteins and two differentially expressed metabolites. LR, low‐risk patients. HR, high‐risk patients. (B) Boxplots of nine selected differentially expressed proteins and two selected differentially expressed metabolites. (C) Protein network including 12 selected differentially expressed proteins
