
Figure 1.
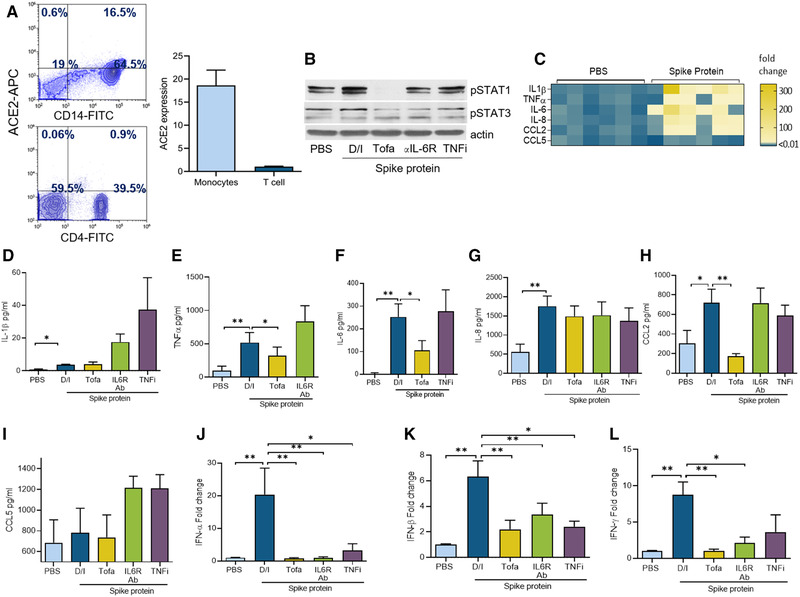
Tofacitinib restrains MΦ inflammatory phenotype as well as type I and II IFN responses activated by Spike protein. (A) ACE2 frequency was quantified in negatively selected blood monocytes (for CD14 staining) or PBMCs (for CD4 staining) using ACE2, CD14, or CD4 staining and measured by flow cytometry, n = 3 samples from two independent experiments; the gating strategy is demonstrated in Supplementary 4–6. (B) MΦs were pretreated with (DMSO/IgG control; D/I), Tofa (10 μM), anti‐IL‐6R Ab (10 μg/mL), or TNFi (10 μg/mL) o/n before PBS and Spike protein treatment (Exonbio; 30 nM) for 30 min and cell lysates were probed for pSTAT1, pSTAT3, and actin (loading control) by Western blot, n = 1 sample; data representative of three independent experiments (raw WB images are shown in Supporting Information 3). (C) MΦs were untreated (PBS) or treated with Spike protein (30 nM) for 8 h before evaluating the transcription regulation of the proinflammatory factors by real‐time RT‐PCR normalized to GAPDH, n = 3 samples from two independent experiments. MΦs (D‐K) or PBMCs (L) were pretreated with D/I, Tofa (10 μM), IL‐6R Ab (10 μg/mL), or TNFi (10 μg/mL) o/n before treating the cells with PBS or Spike protein (30 nm) for 8 h. Protein or mRNA levels of IL‐1β, TNF, IL‐6, IL‐8, CCL2, CCL5, IFN‐α, IFN‐β (D‐K) and IFN‐γ (L) was measured by ELISA or RT‐PCR, n = 3 samples from three independent experiments. The data are shown as mean ± SEM, *p < 0.05, **p < 0.01. The data were also analyzed using a two‐tailed Student's t‐test for comparisons among two groups, or one‐way ANOVA followed by Tukey's multiple comparison test among multiple groups.