
Figure 2.
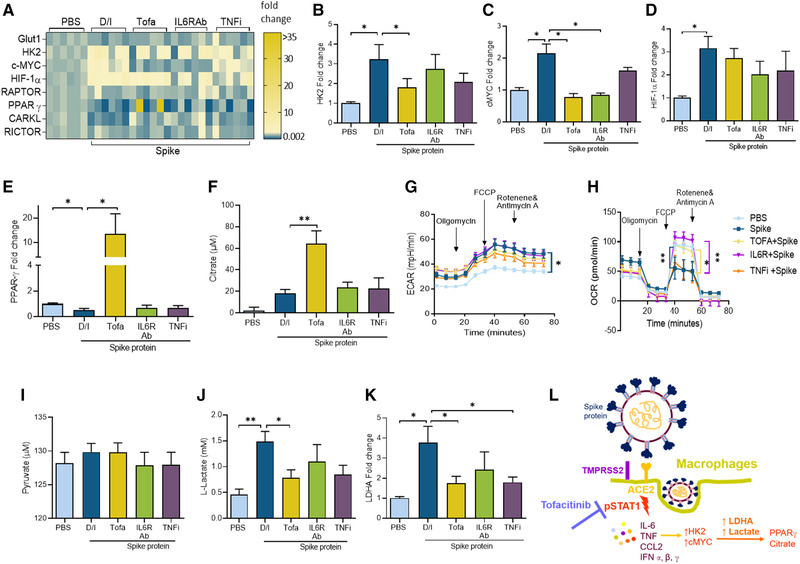
Tofacitinib reverses Spike‐protein‐induced MΦ metabolic rewiring. MΦs were pretreated with DMSO/IgG, Tofa (10 μM), 10 μg/mL of anti‐IL‐6R Ab, or TNFi o/n before PBS or Spike protein (30 nM) treatment for 8 h. The transcriptional regulation of the metabolic intermediates quantified by real‐time RT‐PCR and normalized to GAPDH is presented as a heatmap (A) or data are shown as bar graphs for HK2, cMYC, HIF1α, PPARγ, and citrate (B–F), n = 3 samples from two independent experiments. ECAR (G) and OCR (H) were measured using Mito Stress Test Kit in RAW cells (5000/well) that were untreated (PBS) or stimulated with Spike protein (300 nM plus D/I) or with Tofa (10 μM), 10 μg/mL of anti‐IL‐6R Ab or TNFi for 24 h before taking 12 measurements from 0 to 75 min by Seahorse Bioscience XF96 analyzer, n = 3 replicates from independent three experiments. Conditioned media were obtained from MΦs pretreated with D/I, Tofa (10 μM), 10 μg/mL of anti‐IL‐6R Ab, or TNFi o/n before PBS or Spike protein (30 nM) 8 h treatment before quantifying pyruvate (I) and lactate (J) by colorimetric assay or LDHA transcriptional regulation by real‐time RT‐PCR and normalized to GAPDH (K), n = 3 samples from three independent experiments. (L) Schematic figure illustrates Spike protein's mechanism of action in MΦs. The data are shown as mean ± SEM, *p < 0.05, **p < 0.01. One‐way ANOVA followed by Tukey's multiple comparison test among multiple groups.