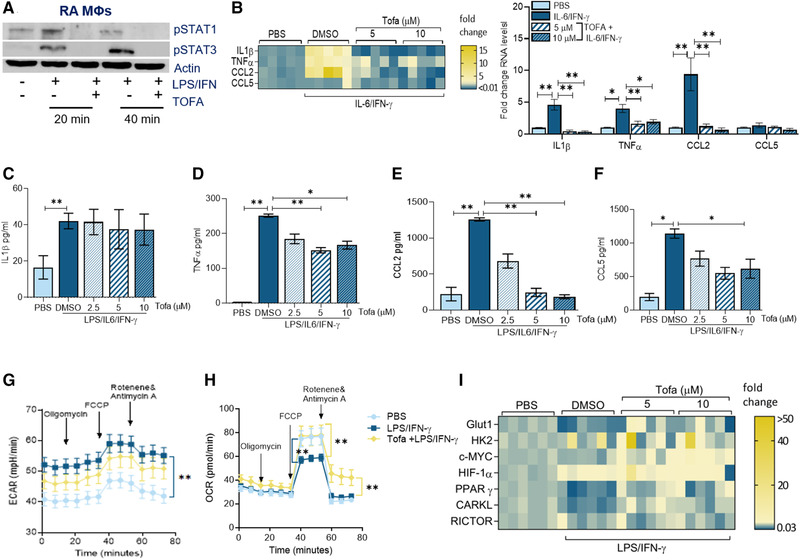
Figure 3.

Tofacitinib impairs RA MΦ inflammatory response by expanding mitochondrial oxidative phosphorylation. (A) RA MΦs were either untreated (PBS) or treated with IL‐6/IFN‐γ (100 ng/mL each) in the presence of DMSO (‐) or Tofa (10μM; +) for 20 min or 40 min before detecting pSTAT1 and pSTAT3 or actin (loading control) by Western blotting, n = 1 sample, data representative of three independent experiments (raw WB images are shown in Supporting Information 3). (B) RA MΦs were pretreated with DMSO or Tofa (5–10 μM) o/n before PBS or IL‐6/IFN‐γ (100 ng/mL each) stimulation for 6 h followed by evaluating the transcriptional regulation of inflammatory markers including IL‐1β, TNF‐α, CCL2, and CCL5, quantified by real‐time RT‐PCR normalized to GAPDH, n = 3 samples are from two independent experiments (shown as a heatmap or bar graph). RA MΦs were pretreated with DMSO or Tofa (5–10 μM) o/n before PBS or IL‐6/IFN‐γ (100 ng/mL each) stimulation for 24 h before analyzing the protein levels of IL‐1β (C), TNF‐α (D), CCL2 (E), and CCL5 (F) by ELISA, n = 3–4 samples from two independent experiments. ECAR (G) or OCR (H) capacity was measured using Mito Stress Test Kit in RAW cells (5000/well) pretreated with PBS, LPS/IFN‐γ (100 ng/mL each) with DMSO or Tofa (10 μM) o/n before taking 12 measurements from 0 to 75 min by Seahorse Bioscience XF96 analyzer, n = 3 samples from two independent experiments. (I) RA MΦs were pretreated with DMSO, 5 μM or 10 μM of Tofa o/n before PBS or LPS/IFN‐γ (100 ng/mL each) stimulation for 6 h. Transcriptional regulation of the glycolytic (GLUT1, HK2, cMYC, and HIF1α) and the oxidative (PPARγ, CARKL, and RICTOR) intermediates were determined by real‐time RT‐PCR and normalized to actin, n = 3 samples from two independent experiments (statistical analysis is shown in Supporting Information Fig. S7). The data are shown as mean ± SEM, *p < 0.05 and **p < 0.01. One‐way ANOVA followed by Tukey's multiple comparison test among multiple groups.
