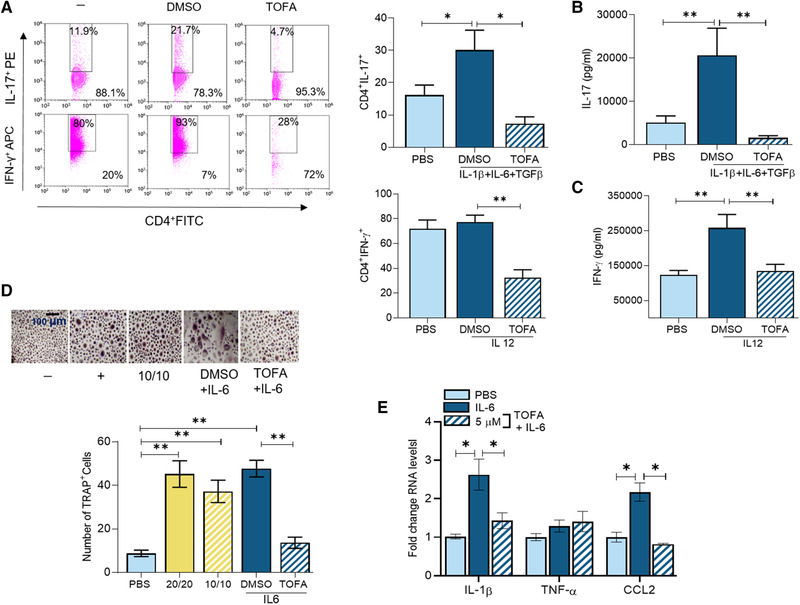
Figure 5.

Tofacitinib disrupts Th1/Th17 cell polarization and osteoclastogenesis in RA patients. Frequency of Th1 and Th17 cells (A) measured by flow cytometry or protein levels of IL‐17 (B) and IFN‐γ (C) measure by ELISA were determined in RA PBMCs in the presence of CD3 Ab plus CD28 Ab (0.25 μg/mL each), which were either untreated (PBS) or treated with IL‐12 (10 ng/mL; Th1 +Ctl), TGF‐β (4 ng/mL) and IL‐1β + IL‐6 (20 ng/mL; Th17 +Ctl) in the presence of DMSO or Tofa (10 μM) for 4 days and cells and conditioned media were harvested for quantifying Th1 or Th17 cell frequency or IFN‐γ or IL‐17 production, n = 3 samples are from three independent experiments. (D) RA PBMCs were cultured in suboptimal levels of RANKL/M‐CSF (10 ng/mL each; 10/10) alone or with IL‐6 (200 ng/mL) in the presence of DMSO or Tofa (5 μM) for 14–21 days. The negative control was cells cultivated in 10% FBS/αMEM and the positive control was 20 ng/mL of RANKL/M‐CSF. The number of TRAP+ cells/HPF was counted on microscopic images taken at 10× magnification. (E) Osteoclast progenitor cells were either untreated (PBS) or treated with IL‐6 (100 ng/mL each) in the presence of DMSO or Tofa (5 μM) for 7 h before quantifying IL‐1β, TNF‐α, or CCL2 by real‐time RT‐PCR and normalized to GAPDH, n = 3 samples are from three independent experiments. The data are shown as mean ± SEM, * < 0.05 and **p < 0.01. The data were also analyzed using a two‐tailed Student's t‐test for comparisons among two groups, or one‐way ANOVA followed by Tukey's multiple comparison test among multiple groups.
