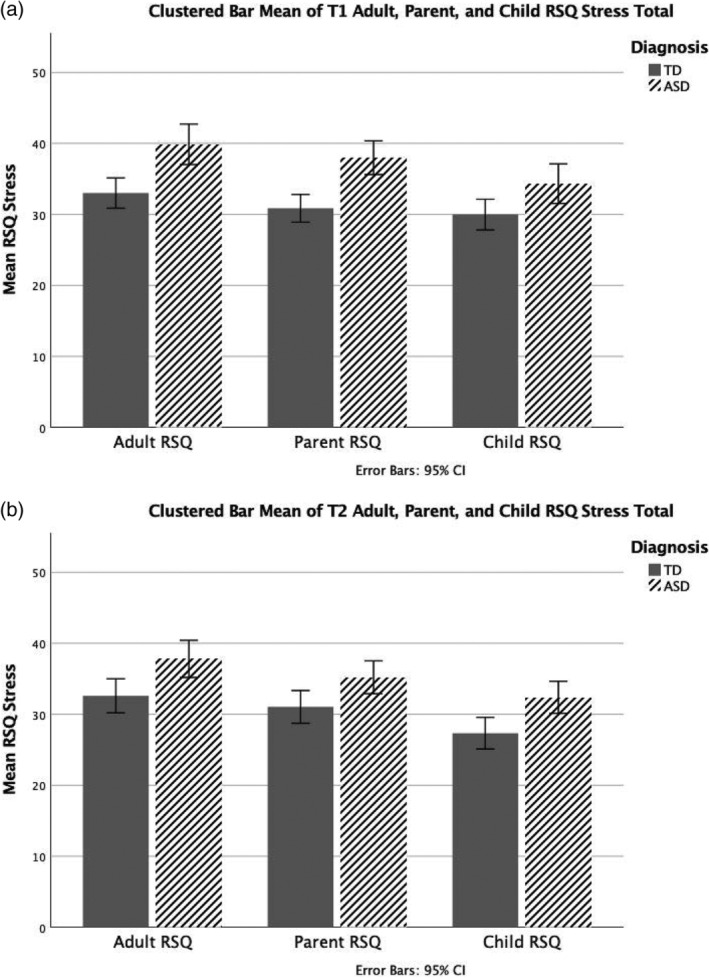
FIGURE 1.

Clustered bar graph of Adult, Parent, and Child RSQ Total stress at T1 and T2. (a) Clustered bar mean of T1 Adult, Parent, and Child RSQ Total stress. T1 refers to the one‐month period (April 27–May 29, 2020) which overlapped with the initial peak of the COVID‐19 stay‐at‐home orders. (b) Clustered bar mean of T2 Adult, Parent, and Child RSQ Total stress. T2 refers to the period three months after the initial peak of the stay‐at‐home orders (i.e., August 2–September 10, 2020) which overlapped with partial, phase‐based reopening of the community. ASD, autism spectrum disorder; RSQ, responses to stress questionnaire; TD, typically developing
