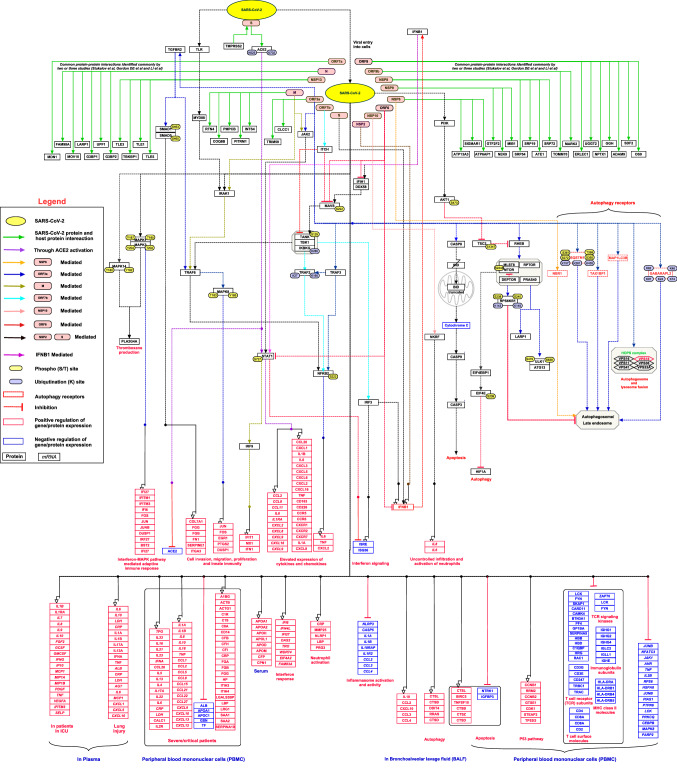
Fig. 1.
A schematic representation of the SARS-CoV-2 signaling pathway. The pathway map represents protein–protein interactions and the downstream molecular events regulated by SARS-CoV-2 including molecular association, catalysis, and gene regulation events. Each event is color-coded as described in the pathway legend. Information on site and residue of post-translational modification is also included in the pathway map

