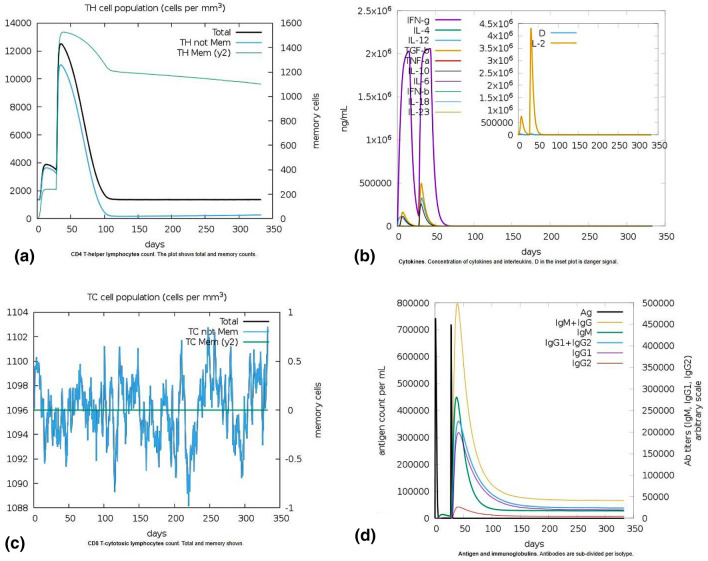
Fig. 8.
Prediction of immune simulation response to the vaccine construct using C-ImmSim. In silico immune simulation study by C-ImmSim software in response to a double dose administration of the vaccine construct at intervals of 4 weeks. The population of activated a CD4 + T helper cells and b CD8 + cytotoxic T cells in terms of memory response generated after the injections. Plot c shows cytokines levels observed after the injections while d shows the levels of antibody titers generated after the injections. In plot c; the inset shows blue colored peak D which is defined as emergence of diversity of epitope specific T cell clones. Lower D value depicts lower diversity

