
Fig. 4.
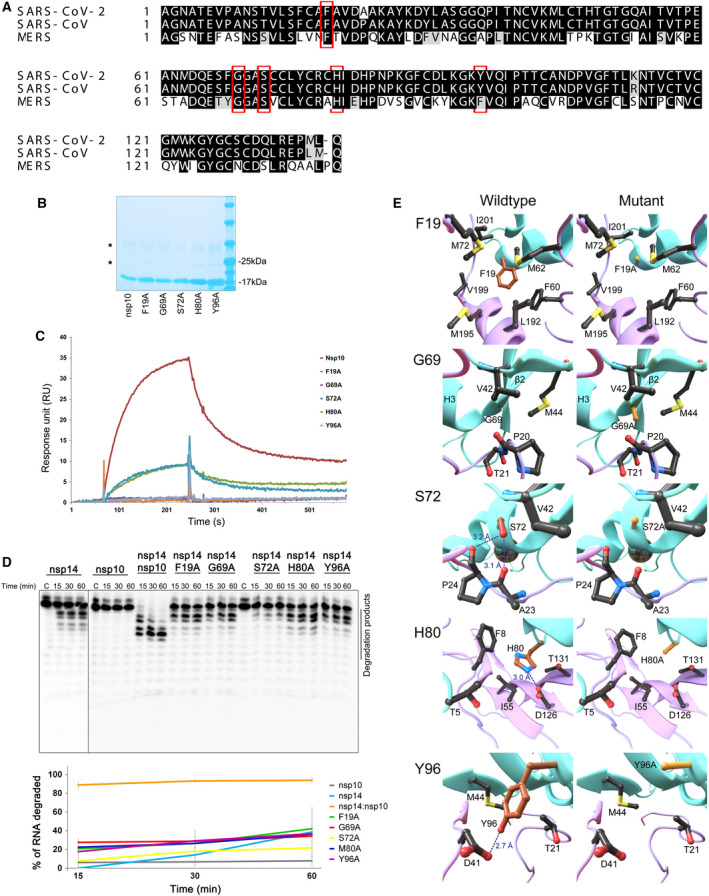
Influence of nsp10 mutations on nsp14‐nsp10 complex formation and ExoN activity. (A) Sequence alignment of nsp10 from SARS‐CoV‐2 (UniProt ID: P0DTD1), SARS‐CoV (UniProt ID: P0C6X7), and MERS (YP_009047225). Residues mutated in this work are highlighted with a red box. (B) SDS/PAGE analysis of the purified nsp10 WT and mutant versions F19A, G69A, S72A, H80A, Y96A. Samples were denatured and separated in a Novex™ 8‐16% Tris/Glycine Gel (Invitrogen™). Gel was stained with BlueSafe (NZYTech, Portugal) to visualize protein bands. NZYColour Protein Marker II (NZYTech, Portugal) was used as a molecular weight marker, and its respective band sizes are represented. (C) Surface plasmon resonance analysis. Nsp10 WT and mutant versions were injected over nsp14 at a concentration of 75 nm. The sensorgram represents the average of three independent injections of each protein. (D) Activity of nsp14 (40 nm) in the presence of nsp10 WT and mutant versions (160 nm). Reactions were analyzed on 7 m urea/20% polyacrylamide gels. C, control reactions; time points are indicated in the top of each panel. All the experiments were performed at least in triplicate. The % of H4 RNA degraded by nsp14 WT and nsp10 mutant versions was determined and represented in the bottom panel. (E) Position of the nsp10 mutations and their neighboring residues. The WT and mutated structures of F19A, G69A, S72A, H80A, and Y96A mutations are depicted on the left and right columns, respectively. Carbons of the WT and mutated residues are colored in brown and orange, respectively. Hydrogen bond and salt‐bridges are marked in dashed lines with the respective distances. The nsp10 and nsp14 secondary structures are marked in cyan and purple, respectively.