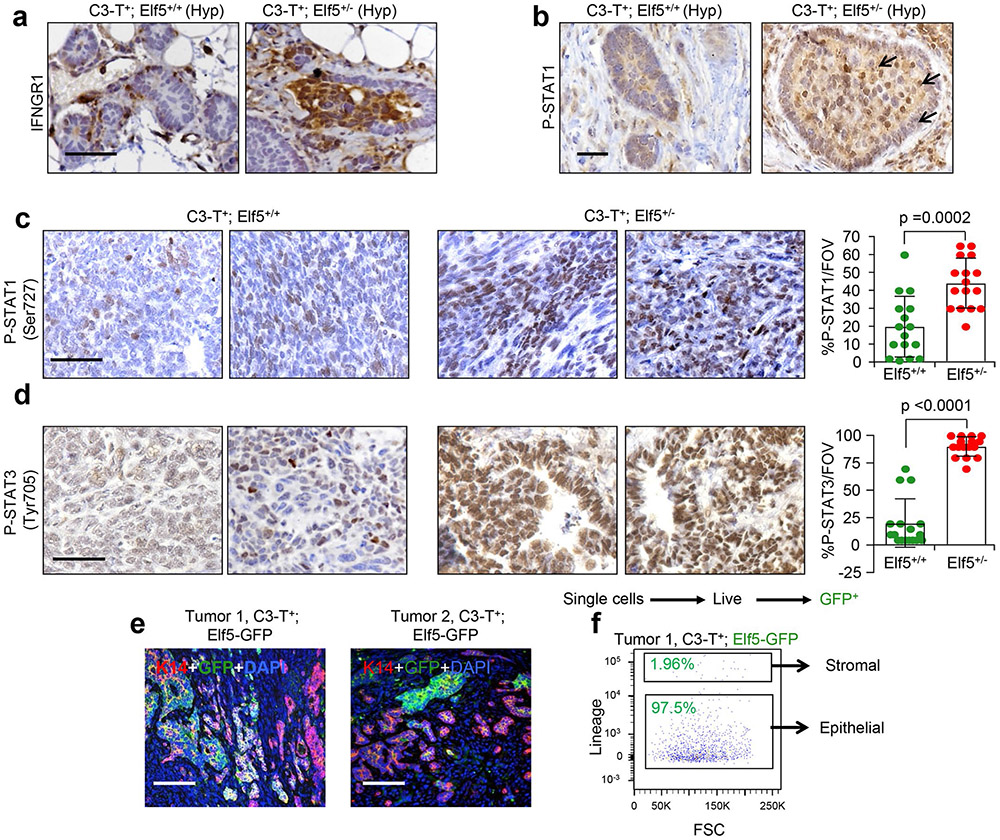
Extended Data Fig. 2 ∣. Hyperplastic mammary glands from C3-T+; Elf5+/− tumors show increased P-STAT1 and P-STAT3 protein levels and Elf5 is predominantly expressed in tumor cells.
a, b, IHC staining indicates increased staining of IFNGR1 and P-STAT1 protein in hyperplastic mammary glands harvested from C3-T+; Elf5+/− compared to C3-T+; Elf5+/+ mice. One representative image is shown from multiple experiments (n=5). Arrows in (b) indicate P-STAT1+ cells. c, d, IHC staining indicates increased staining of P-STAT1 (Ser727) and P-STAT3 (Tyr705) proteins in tumors harvested from C3-T+; Elf5+/− compared to C3-T+; Elf5+/+ mice. n=5 individual tumors were taken in each group and quantification was done using 16 random fields. Two-tailed Mann-Whitney U test was used to calculate statistical significance and data is represented as mean ± SEM in (c) and mean ± SD in (d). e, Immunofluorescence image showing expression of GFP (Elf5) in tumor cells and their absence in stromal cells in tumor tissues obtained from C3-T+; Elf5-GFP. Absence of GFP in stromal cells of C3-T+ was confirmed by immunofluorescence in n=5 tumors. f, Flow cytometry graph showing presence of Elf5 predominantly in epithelial cells in tumors obtained from C3-T+; Elf5-GFP, one representative image shown from multiple experiments (n=5). FOV; Field of view. Scale bar in (a, c, d, e) 40 μm, (b) 20 μm.

