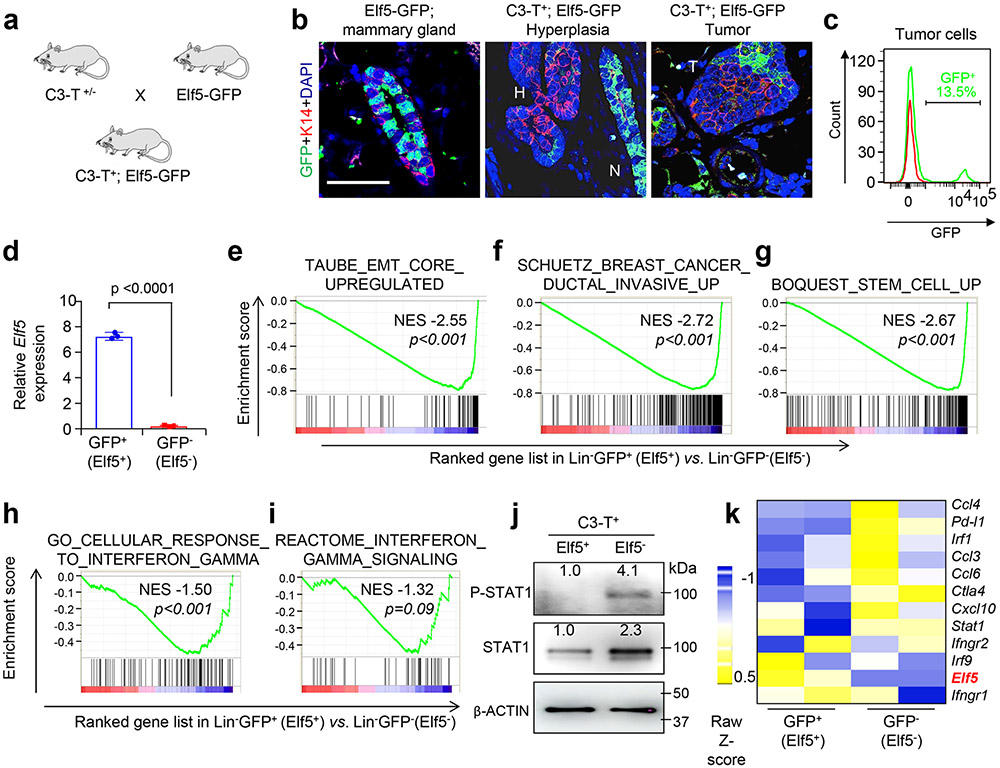
Extended Data Fig. 3 ∣. Elf5 negatively correlates with IFN-γ signaling in C3-T+ tumors.
a, Schematic diagram showing generation of C3-T+; Elf5-GFP mice. b, Immunofluorescence images showing Elf5 loss during progression from mammary gland (N) to hyperplasia (H) to tumors. K14 antibody was used to mark basal epithelial cells. Experiment was repeated twice with similar results. c, Histogram showing %GFP+ cells in epithelial enriched tumor cells in C3-T+; Elf5-GFP mice. Tumor cell enriched population was sorted using CD31, CD45 and Tert119 markers following published protocol37. Red line denotes WT tumor cells as control. Experiment was repeated thrice with similar results. d, qPCR analysis of Elf5 expression in GFP+ and GFP− tumor cells sorted from C3-T+; Elf5-GFP mice, n=3. qPCR values were normalized to the housekeeping gene Gapdh. Experiments were performed three times, each with qPCR in technical duplicate, and data presented as the mean ± SD. Two- tailed Student′s t test was used to calculate statistical significance. e-i, GSEA graphs showing high EMT signatures, (e); increased invasive signatures, (f); high expression of signatures associated with stemness, (g); and increased IFN-γ signaling in GFP− (Elf5−) tumor cells, (h-i). n=2 GFP+ and n=4 GFP− samples were used for RNA sequencing and GSEA analysis. Statistical significance was assessed by comparing the ES to enrichment results generated from 1000 random permutations of the gene set to obtain p values (nominal p value) j, Western blot showing high P-STAT1 and STAT1 in GFP− (Elf5−). Cell sorting was performed to isolate tumor cells and multiple independent tumors were pooled to make samples. This is a representative blot and experiment was repeated twice with n=9 tumors. k, Heat map showing increased ISG in GFP− (Elf5−) tumor cells. n=2 GFP+ and n=4 GFP− tumor cell population was used to generate heat map. Scale bar in (b), 20 μm.

