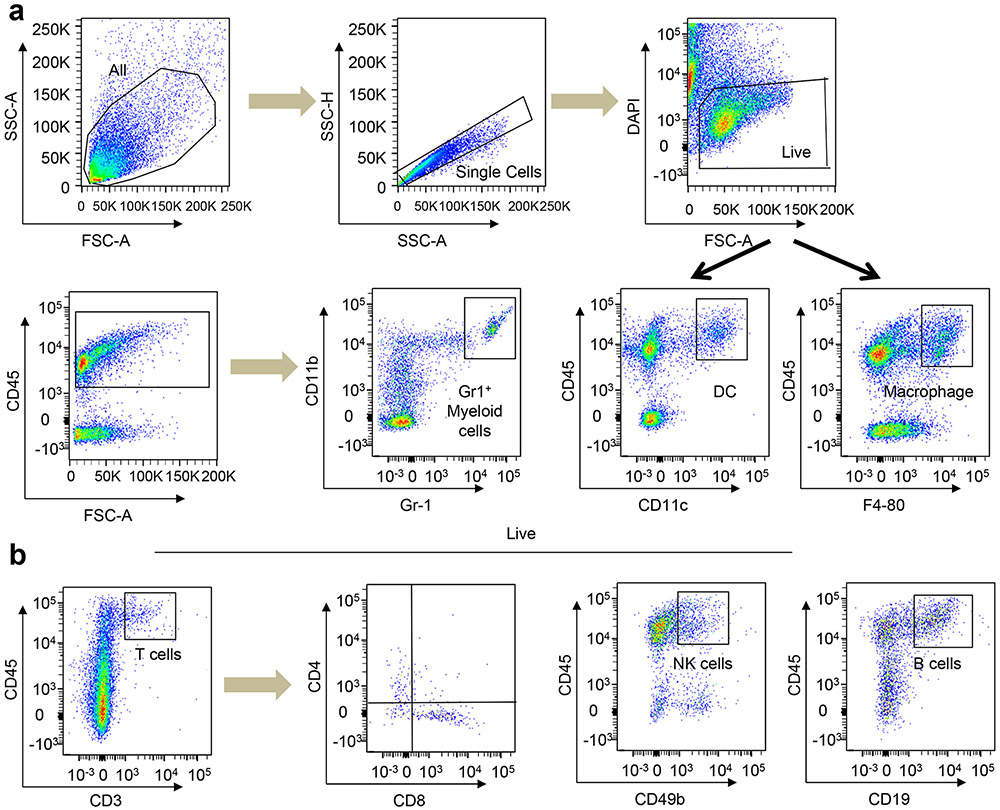
Extended Data Fig. 6 ∣. Flow cytometry gates showing different immune populations.
All the gates were drawn according to published protocol from Dr. Vonderheide group59. (a, b) Different myeloid and lymphoid populations are shown in a and b respectively.

