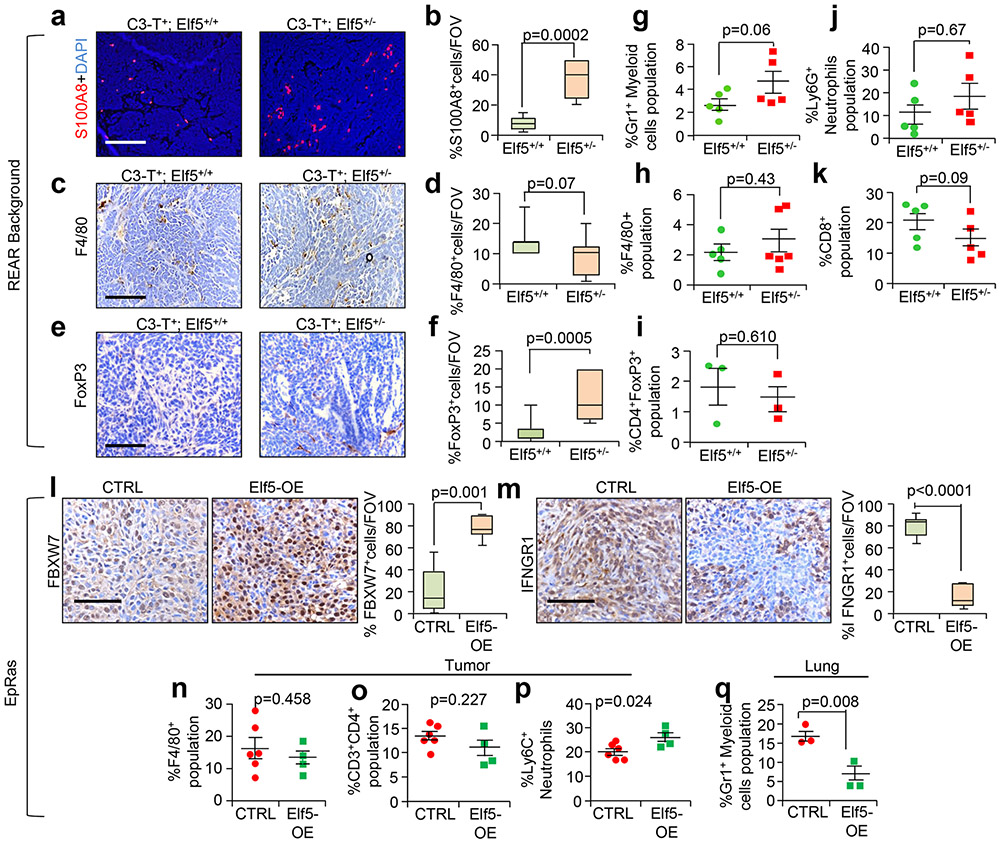
Extended Data Fig. 7 ∣. Alteration of Elf5 in tumor cells alters TME in REAR background.
IHC analysis shows a, b, increased myeloid cells in C3-T+; Elf5+/− (n=8 FOV) tumors as compared to C3-T+; Elf5+/+ (n=6 FOV) c, d, decreased number of macrophages in C3-T+; Elf5+/− tumors (n=9 FOV) as compared to C3-T+; Elf5+/+ tumors (n=7 FOV), e, f, increased number of Foxp3+ cells in C3-T+; Elf5+/− tumors. (n=10 FOV for C3-T+; Elf5+/+ and n=11 FOV for C3-T+; Elf5+/−), n=3 individual tumors were used in a-f. g, j, increased Gr1+ myeloid cells (n=5 tumors/group) and Ly6G+ neutrophils (CD45+CD11b+Gr1+) (n=5 tumors/group) and decreased k, cytotoxic T-cells (CD45+CD8+) population in C3-T+; Elf5+/− tumors as compared to C3-T+; Elf5+/+ tumors (n=5 tumors/group) h, Macrophages (CD45+F4/80+) (n=5 C3-T+; Elf5+/+ tumors and n=6 C3-T+; Elf5+/− tumors) and i, Regulatory T-cells (CD45+CD3+FoxP3+) (n=3 tumors/group) were observed. IHC image showing increased FBXW7 (n=6 tumors for control and n=7 tumors for Elf5-OE from n=3 independent tumors). (l), decreased IFNGR1 (n=10 FOV for control and n=7 FOV for Elf5-OE from n=3 independent tumors) m, in Elf5-OE EpRas tumors. FACS plots showing no change in n, macrophages, o, CD4+ T-cells, p, increased Ly6C+ neutrophils in Elf5-OE tumors (n=6, control and n=4, Elf5-OE individual tumors). q FACS plots showing decreased number of Gr1+ myeloid cells in lungs of EpRas Elf5-OE tumor bearing mice (n=3 individual tumors/group). (a-j and n-q) Two-tailed student′s t test was used to compute p-value. (k, l, m) Mann-Whitney U test was used to calculate p value. Data are presented as the mean ± SEM. FOV; Field of view. (b, d, f, l, m) Boxplot data represent median, interquartile range, and spikes to upper and lower adjacent values. FOV; Field of view. (a, c, e, l, m) Images are representative of minimum three independent experiments, Scale bars, 40 μm.

