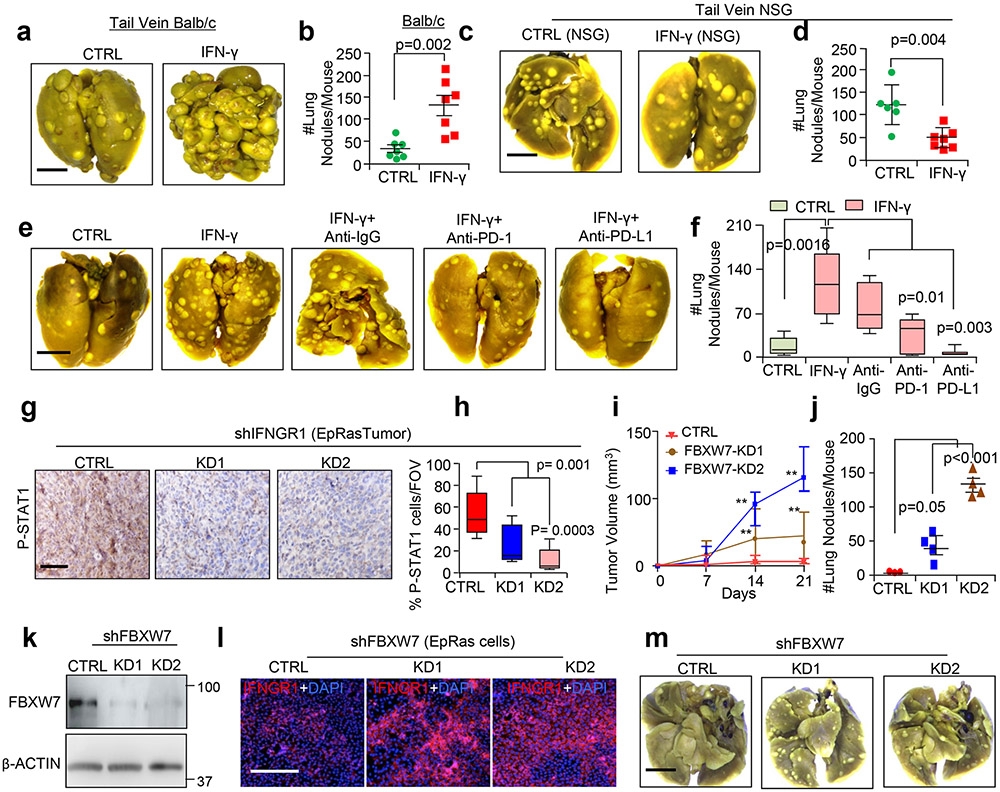
Extended Data Fig. 9 ∣. IFN-γ signaling renders more metastatic properties to EpRas cells via PD-1/PD-L1 signaling.
a, b, Tail vein (TV) injection of control and IFN-γ treated EpRas cells, n=7 mice/group. c, d, Lung images and metastatic nodule numbers in NSG mice injected with EpRas cells treated with IFN-γ via TV (n=6 mice, control and n=7 mice, IFN-γ treated). e, f, TV injection of control and IFN-γ treated EpRas cells in mice treated with anti-IgG (n=5 mice), anti-PD-1 (n=5 mice) and anti-PD-L1 (n=6 mice) antibodies. g, h, IHC in tumors from control cells compared to IFNGR1-KD tumor cells, n=3 individual tumors were used and 7 random FOV were used. i, FBXW7-KD tumors cells grew faster than control, n=5 tumors/group. k, Western blot showed decreased FBXW7 in EpRas cells transduced with FBXW7 shRNAs compared to control. (l) IF analysis shows increased expression of IFNGR1 in FBXW7-KD cells compared to control. Experiment was repeated twice (k, l). j, m, TV injection of control and FBXW7-KD EpRas cells shows increased number of lung metastasis in FBXW7-KD mice compared to control mice, n=3 CTRL, n=4 KD1, and n=4 KD2 mice were used. Two-tailed Mann-Whitney U test was used to compute p-value in (b, d) and data represented as mean ± SEM (b) or ±S.D (d). Boxplot represent median, interquartile range, and spikes to upper and lower adjacent values (f, h). One-way ANOVA test was used with Tukey post hoc test to compute p-values of multiple comparison data. Data is represented as mean ± SEM (f, h, j). Two-way ANOVA test was used with Bonferroni post hoc test to calculate p values, data is represented as mean ± SD (i). Scale bar (a, c, e, m) 2 mm, (g) 40 μm (l) 100 μm. **p < 0.01, ***p < 0.001. FOV; Field of view.

