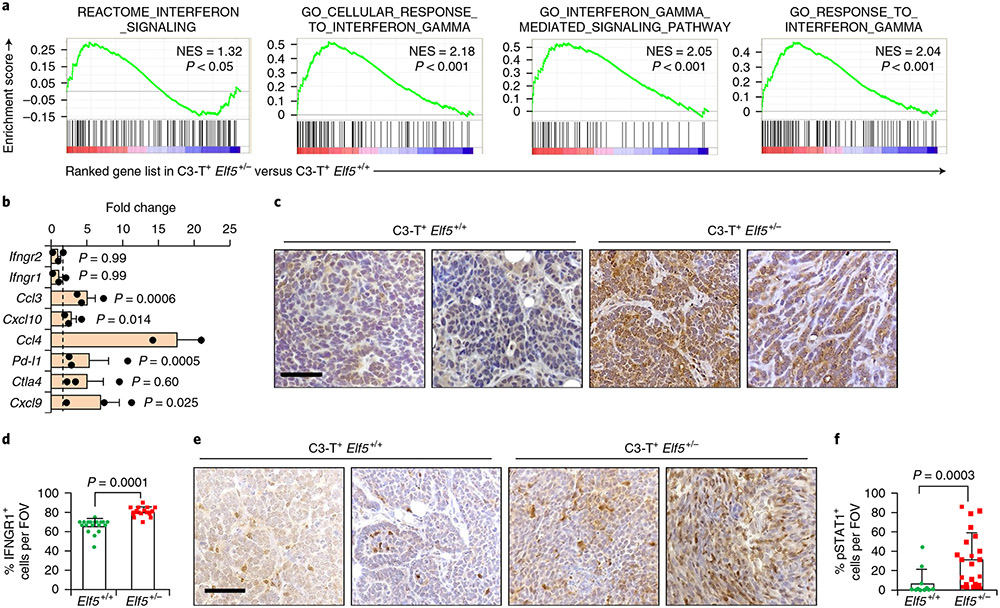
Fig. 2 ∣. Loss of Elf5 promotes IFN-γ signalling in C3-T+ Elf5+/− tumours.
a, GSEA analysis showing increased IFN-γ signalling in tumour cells sorted from C3-T+ Elf5+/− tumours compared with those from C3-T+ Elf5+/+ tumours (n = 2 individual tumours per group). b, qPCR analysis suggesting increased expression of IFN-γ-associated signatures in a tumour cell-enriched population (lineage negative) sorted from C3-T+ Elf5+/− tumours compared with those from C3-T+ Elf5+/+ tumours (n = 2 tumours for C3-T+ Elf5+/+; n = 3 tumours for C3-T+ Elf5+/−; in technical duplicates). Lineage-negative tumour cells were sorted based on CD31, Ter119 and CD45 antibodies37. The relative expression of C3-T+ Elf5+/+ was considered to be a fold change of one, which is depicted by the dashed line. qPCR values were normalized to the housekeeping gene Gapdh. The experiments were performed three times, each with qPCR in technical duplicate. The data are presented as means ± s.e.m. Statistical significance was determined by two-tailed Student’s t-test. c,d, IHC staining (c) and quantification (d) of IFNGR1 in C3-T+ Elf5+/− and C3-T+ Elf5+/+ tumours, showing increased expression of cytoplasmic and membrane IFNGR1 protein in C3-T+ Elf5+/− tumours (n = 3 samples were used, with analysis of n = 14 random fields from C3-T+ Elf5+/+ tumours and n = 16 random fields from C3-T+ Elf5+/− tumours for quantification). The data are presented as means ± s.e.m. e,f, IHC staining (e) and quantification (f) of pSTAT1 in C3-T+ Elf5+/− and C3-T+ Elf5+/+ tumours, showing increased expression of pSTAT1 protein (nuclear) in C3-T+ Elf5+/− tumours (n = 3 individual tumours were used, with analysis of n = 11 random fields from C3-T+ Elf5+/+ tumours and n = 21 random fields from C3-T+ Elf5+/− tumours for quantification). Images in c,e represent IHC staining in two different tumours/group. The data are presented as means ± s.d. Statistical significance in d and f was determined by two-tailed Mann–Whitney U-test. Scale bars in c and e: 40 μm. FOV, field of view; NES, normalized enrichment score.

