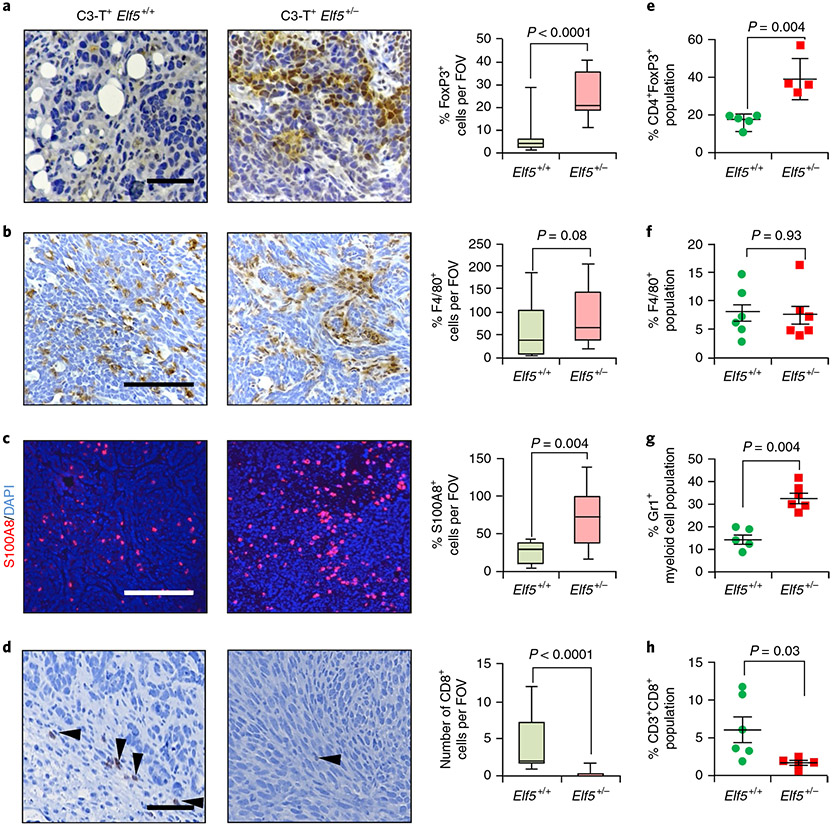
Fig. 4 ∣. Loss of Elf5 alters the immune landscape in C3-T+ tumours.
a, FoxP3 staining shows an increased number of Treg cells in C3-T+ Elf5+/− tumours compared with C3-T+ Elf5+/+ tumours. b, F4/80 staining shows an increased number of macrophages in C3-T+ Elf5+/− tumours compared with C3-T+ Elf5+/+ tumours. c, S100A8 analysis shows an increased number of myeloid cells in tumours from C3-T+ Elf5+/− mice, d, CD8 staining shows decreased numbers of cytotoxic T cells in tumours from C3-T+ Elf5+/− mice (arrowheads). In a-d, images of the stains are shown to the left, with quantification of the results to the right, and n = 3 individual tumours were used with a minimum of ten random fields per genotype for IHC quantification. The boxplot data represent medians, interquartile ranges and spikes to upper and lower adjacent values. Scale bars: 40 μm. e-h, Flow cytometry analyses (FACS) showing increased Treg cells (CD45+CD3+CD4+FoxP3+; e) with no major change in F4/80+ (CD45+G4/80+; f), increased Gr1+ myeloid cells (CD45+CD11b+Gr1+; g) and decreased cytotoxic T cells (CD45+CD3+CD8+; h) in C3-T+ Elf5+/− tumours compared with C3-T+ Elf5+/+ tumours. All of the gates were drawn according to a published protocol59. The scatter plots show the number per group of samples from flow analysis and the data are presented as medians ± s.e.m. Statistical significance was determined by two-tailed Mann–Whitney U-test (a-d and f-h) and two-tailed Student’s t-test (e).

