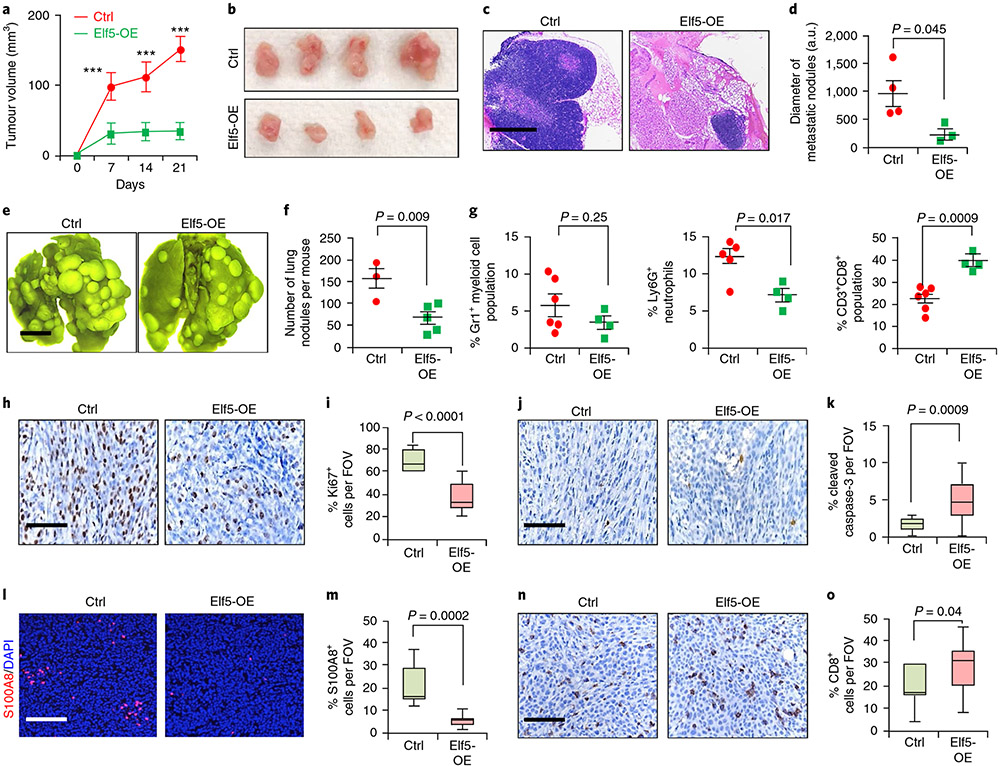
Fig. 5 ∣. Re-expression of Elf5 in EpRas TNBC cells decreases tumour growth and metastasis.
a, Tumour growth curve showing slower tumour progression in Elf5-OE cells compared with control cells (n = 7 tumours for the control; n = 8 tumours for Elf5-OE). A total of 50,000 EpRas cells per MFP were injected. Statistical significance was determined by two-way ANOVA with Bonferroni correction (***P < 0.001). b, Image showing bigger tumours formed from control cells compared with Elf5-OE cells. c,d, Haematoxylin and eosin stains (c) and graphical representation, in arbitary units (a.u.) used by ImageJ (d), showing the presence of larger metastatic lung nodules in control tumours compared with lungs in mice injected with Elf5-OE tumour cells (n = 4 mice for the control; n = 3 mice for Elf5-OE). The images are representative of two independent experiments. e,f, Lung images (e) and graphical representation (f) showing a lower number of metastatic nodules in lungs upon tail vein injection of EpRas Elf5-expressing cells (n = 3 mice for the control; n = 5 mice for Elf5-OE). A total of 150,000 EpRas cells per tail vein were injected. The images are representative of two independent experiments. g, Flow cytometry graphs showing decreased Gr1+ myeloid cells (n = 6 for the control; n = 4 for Elf5-OE tumours), decreased Ly6G+ neutrophils (n = 5 for the control; n = 4 for Elf5-OE tumours) and increased CD8+ T cells (n = 6 for the control; n = 4 for Elf5-OE tumours) in primary mammary tumours formed from Elf5-OE cells. h,i, IHC images (h) and graphical representation (i) showing decreased Ki67+ cells in Elf5-OE tumour cells, j,k, IHC images (j) and graphical representation (k) showing Increased cleaved caspase-3 in Elf5-OE tumour cells. l,m, Immunofluorescence image (l) and graphical representation (m) showing decreased neutrophils in Elf5-OE tumours, n,o, IHC images (n) and graphical representation (o) showing increased CD8+ T cells in Elf5-OE tumour cells. In d, f, g and h-o, statistical significance was determined by two-tailed Student’s t-test. In a, d, f and g, the data are presented as means ± s.e.m. The boxplot data represent medians, interquartile ranges and spikes to upper and lower adjacent values. Scale bars: 100 μm (c), 2 mm (e) and 40 μm (h, j, l and n).

