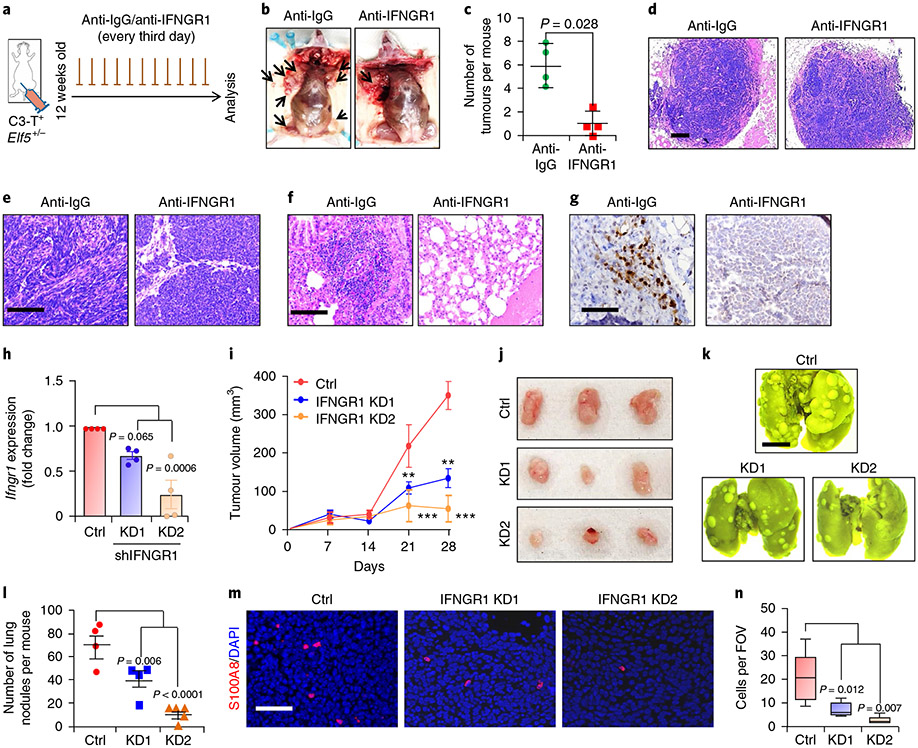
Fig. 6 ∣. Antibody-mediated and genetic inhibition of IFNGR1 in TNBC cells hampers tumour growth and metastasis.
a-c, Schematic of the experiment (a), mouse images (b) and a graph (c) showing the reduced tumour burden in C3-T+ Elf5+/− mice upon injection of anti-IFNGR1 (n = 4 mice per group for anti-IgG (500 μg per mouse per injection) or anti-IFNGR1 antibody (500 μg per mouse per injection). Statistical significance was determined by two-tailed Mann–Whitney U-test. The data are presented as means ± s.d. The arrows in b point to tumours. d,e, Haematoxylin and eosin analysis of tumours, showing the absence of invasive edges (d) and reversal of the mesenchymal phenotype (e) of C3-T+ Elf5+/− tumours upon neutralization of IFNGR1. f, Lung metastasis was reversed in C3-T+ Elf5+/− mice injected with anti-IFNGR1 antibody. g, Reduced pSTAT1 was observed in tumours harvested from the group injected with anti-IFNGR1 antibody. In d-g, the images are representative of two independent experiments. h, qPCR confirmed decreased mRNA of IFNGR1 in EpRas cells transduced with IFNGR1 shRNA. qPCR values were normalized to Gapdh (n = 4 biological replicates pooled from two independent experiments). The data are presented as means ± s.d. i,j, Graph (i) and images (j) showing decreased tumour growth in EpRas cells with IFNGR1 knockdown (KD1 and KD2) (n = 4 for the control and shIFNGR1 KD1; n = 5 for shIFNGR1 KD2). In i, statistical significance was determined by two-way ANOVA with Bonferroni post-test correction (**P < 0.01; ***P < 0.001). The data are presented as means ± s.e.m. k,l, Lung images (k) and graphical representation (l) showing fewer metastatic nodules upon tail vein injection of IFNGR1 knockdown cells (n = 4 for the control and shIFNGR1 KD1; n = 5 for shIFNGR1 KD2). The data are presented as means ± s.e.m. m,n, Immunofluorescence images (m) and graphical representation (n) showing the reduced number of S100A8+ myeloid cells from Ifngr1 knockdown tumours. The boxplot data represent medians, interquartile ranges and spikes to the upper and lower adjacent values (n = 5 fields of view from two samples per group). In h, l and n, statistical significance for multiple comparisons was determined by one-way ANOVA with Tukey’s post-hoc test. Scale bars: 100 μm (d), 40 μm (e, g and m), 2 mm (k) and 100 μm (f).

