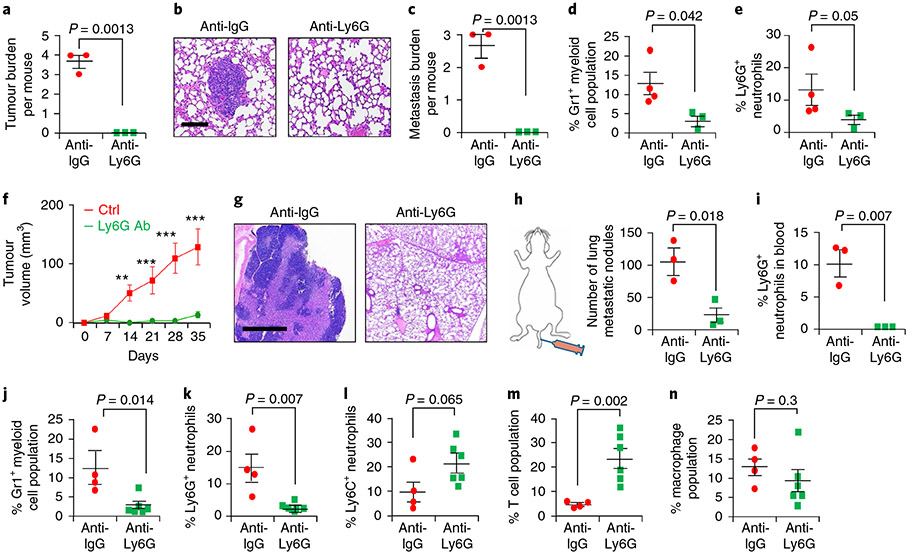
Fig. 7 ∣. Antibody-mediated depletion of Ly6G+ neutrophils decreases tumour growth and metastasis in spontaneous and orthotopic TNBC models.
a-c, Tumour initiation (a) and metastatic burden (as shown by haematoxylin and eosin stains (b) and presented graphically (c)) were severely reduced in C3-T+ Elf5+/− mice injected with anti-Ly6G (250 μg per mouse per injection) compared with those injected with anti-IgG (250 μg per mouse per injection) (n = 3 mice per group). Anti-Ly6G antibody injection was given every third day after 12 weeks of age for the mice in each group. d,e, Anti-Ly6G injection decreased the Gr1+ myeloid population (d) and Ly6G+ neutrophil population (e) in tumours. f, Tumour growth was slower in mice injected with anti-Ly6G antibody (anti-Ly6G Ab; n = 8 individual tumours) compared with IgG control (n = 4 individual tumours) (**P < 0.01; ***P < 0.001). g, Haematoxylin and eosin stain images showing large metastatic nodules in the lungs of mice injected with anti-IgG antibody compared those treated with anti-Ly6G antibody. In f and g, a total of 70,000 EpRas cells were injected into the MFP. Anti-Ly6G treatment (250 μg per mouse per injection) started when tumours were 3 mm × 3 mm, and the drug was given every third day. h, A smaller number of metastatic nodules were obtained in mice injected with anti-Ly6G antibody compared with those receiving anti-IgG antibody. i, Systemic depletion of Ly6G was confirmed in the blood of injected mice (n = 3 mice per group by FACS). In h and i, 150,000 EpRas cells per mouse were injected into the tail vein, and anti-Ly6G antibody injection was given every third day (n = 3 mice per group). j-n, Results of flow cytometry of primary mammary tumours (n = 4 tumours for IgG; n = 6 tumours for anti-Ly6G antibody), showing a decreased Gr1+ myeloid cell population (j), decreased Ly6G+ neutrophils (k), a slight increase in Ly6C+ neutrophils (l), increased T cells (m) and no change in macrophages (n) in EpRas tumour-bearing mice injected via the MFP with anti-Ly6G antibody compared with those injected with IgG antibody. In j-n, each dot in the scatter plot represents an individual tumour. Statistical significance was determined by two-tailed Student’s t-test (a, c, d and h-n), two-tailed Mann–Whitney U-test (e) or two-way ANOVA with Bonferroni post-adjustment (to measure tumour progression; f). The data are presented as means ± s.e.m. Scale bars: 40 μm (b) and 100 μm (g).

