
Fig. 2. Network perturbation by missense somatic mutations in human cancers.
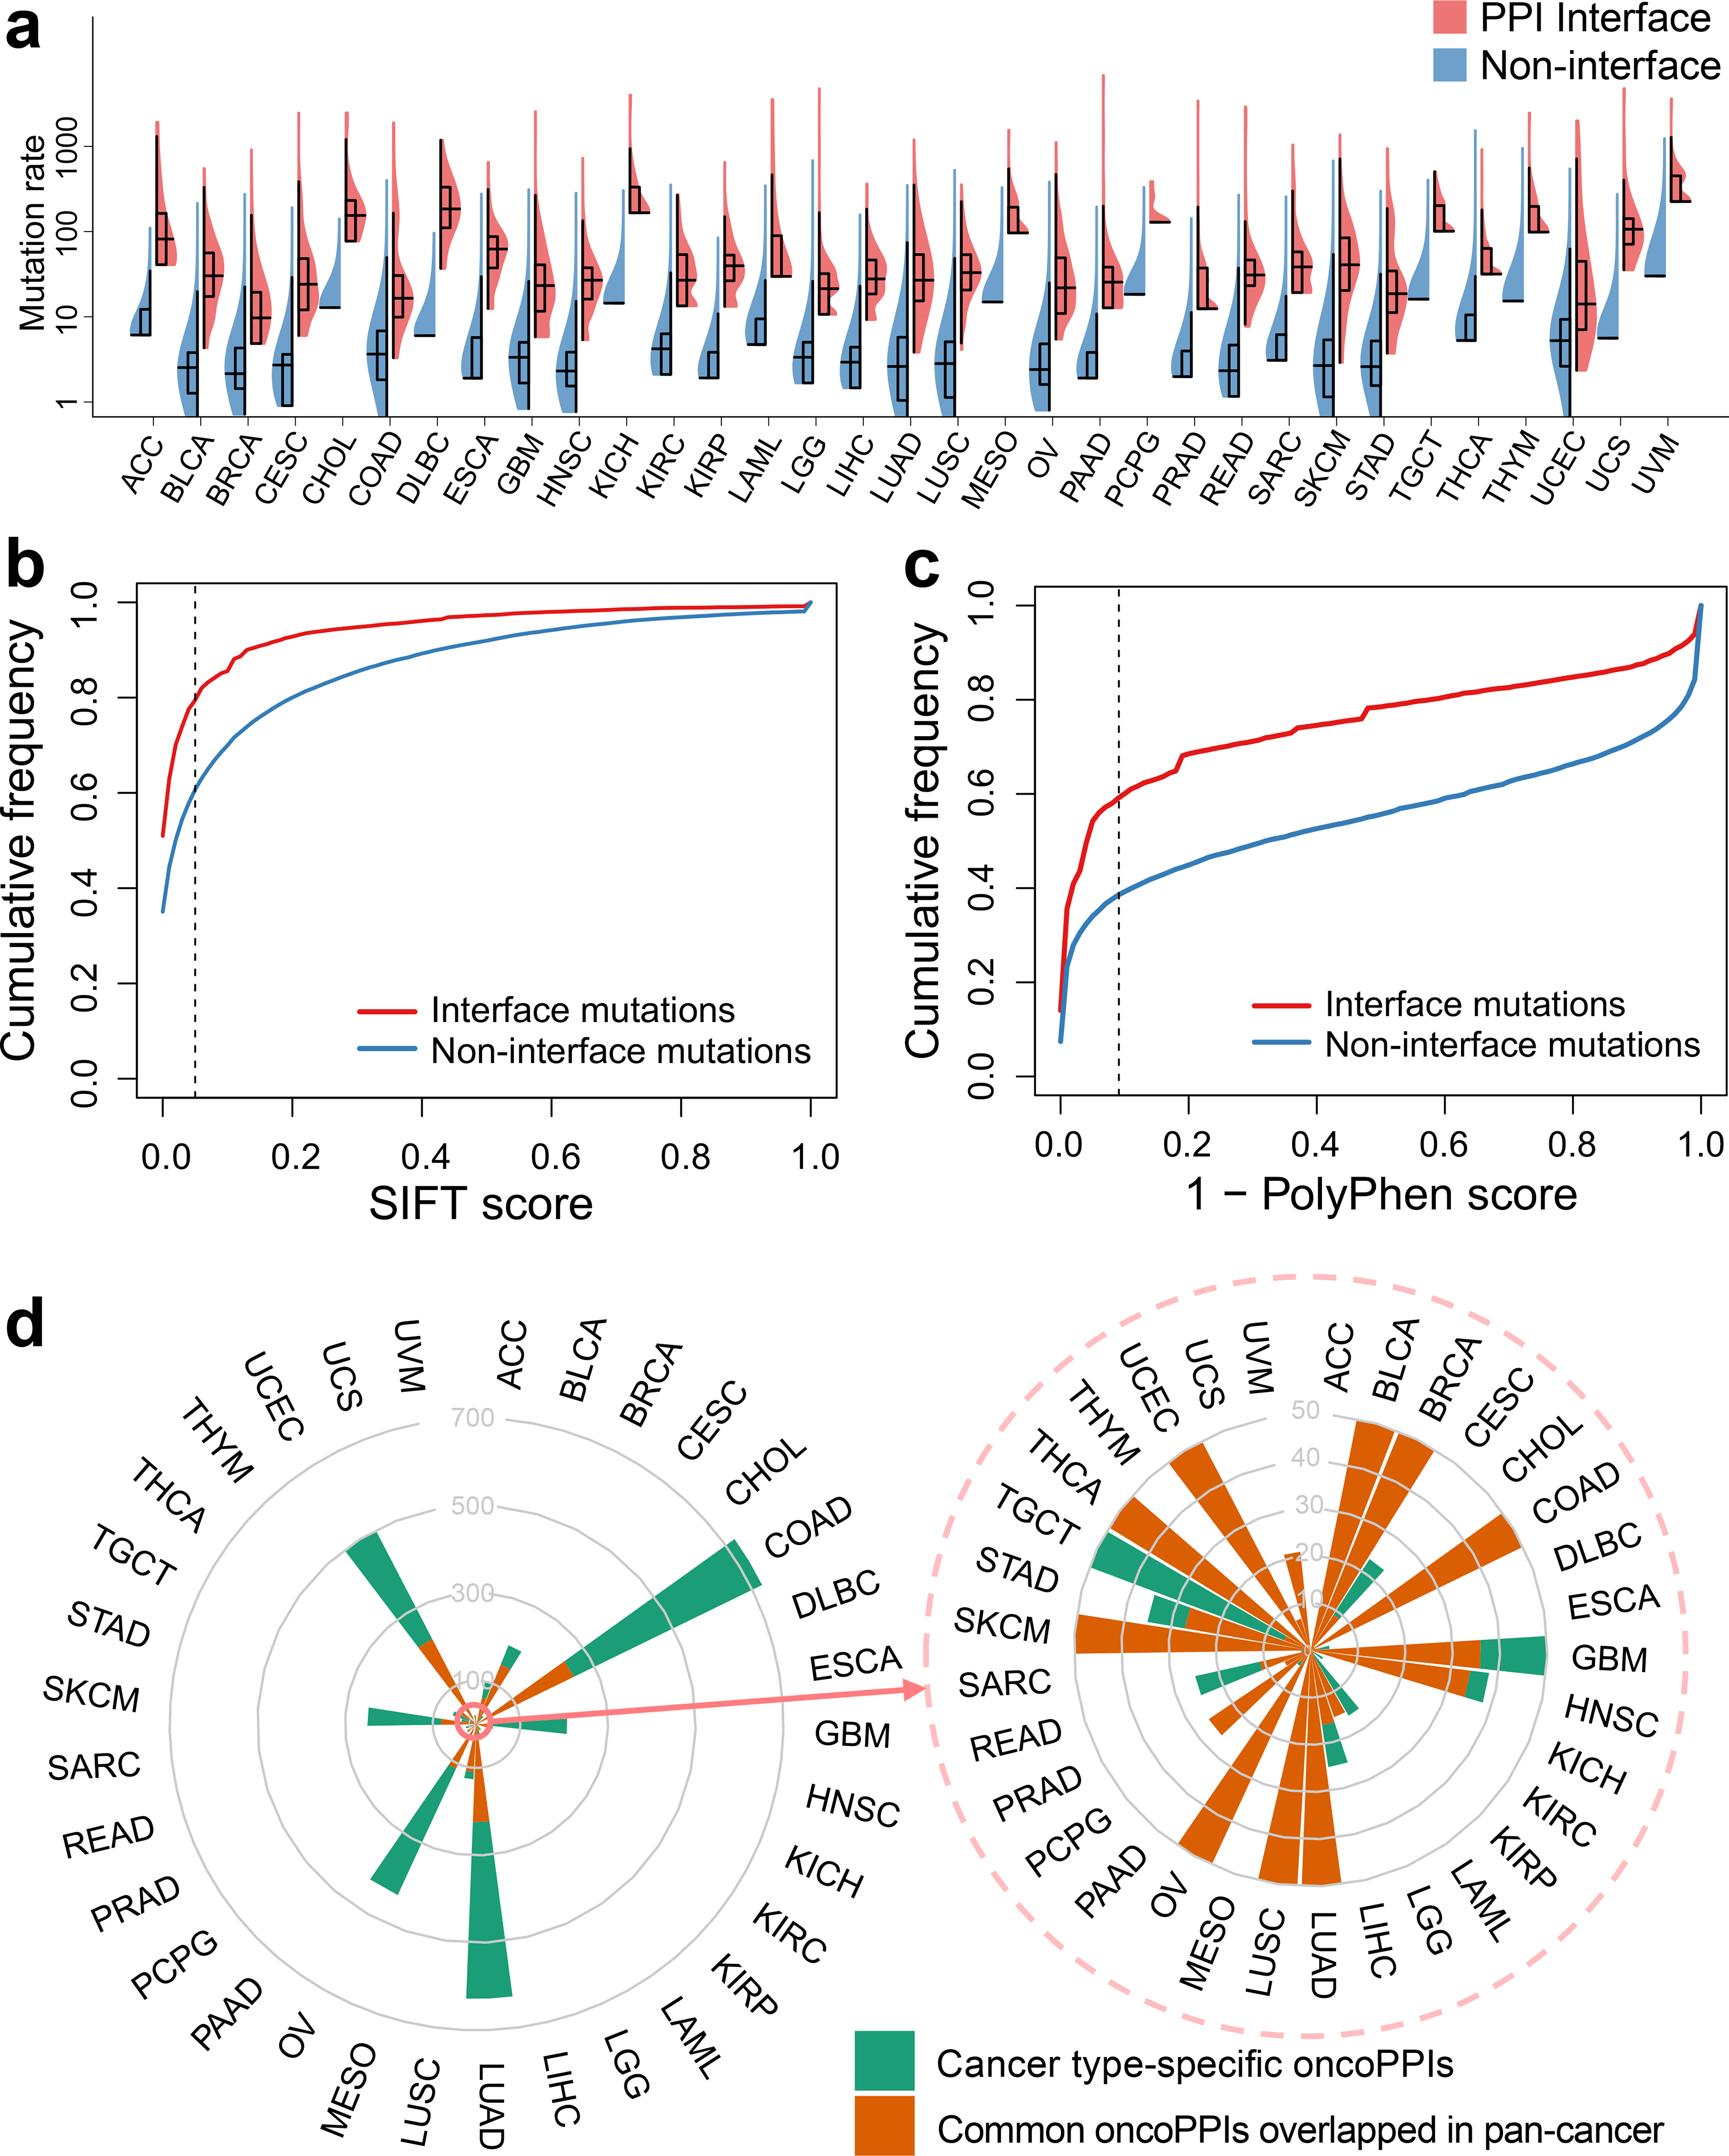
(a) Distribution of missense mutations in protein-protein interfaces versus non-interfaces across 33 cancer types/subtypes from The Cancer Genome Atlas (TCGA). The data are represented as violin plots with underlaid boxplots where the middle line is the median, the lower and upper edges of the rectangle are the first and third quartiles, and the lower and upper whiskers of the violin plot represent the interquartile range (IQR) ×1.5. (b & c) Cumulative frequencies of SIFT (b) and PolyPhen-2 scores (c) for protein-protein interface mutations (red) versus non-interface (green) mutations. Abbreviations of 33 cancer types are provided in the main text. (d) A circos plot illustrating the landscape of significant mutation-perturbed PPIs (termed putative oncoPPIs) which harbor a statistically significant excess number of missense mutations at PPI interfaces across 33 cancer types/subtypes (adjusted p-value < 0.05, see Online Methods). The bar denotes the number of putative oncoPPIs across each cancer type/subtype. Cancer type-specific oncoPPIs are highlighted by green. Overlapped oncoPPIs between individual cancer type and pan-cancer analysis (adjusted p-value < 0.001) are highlighted by orange. The detailed data are provided in Supplementary Table 1. All abbreviations for each cancer type/subtype are provided in main text.