
Fig. 4. Pharmacogenomics landscape of protein-protein interaction-perturbing alleles.
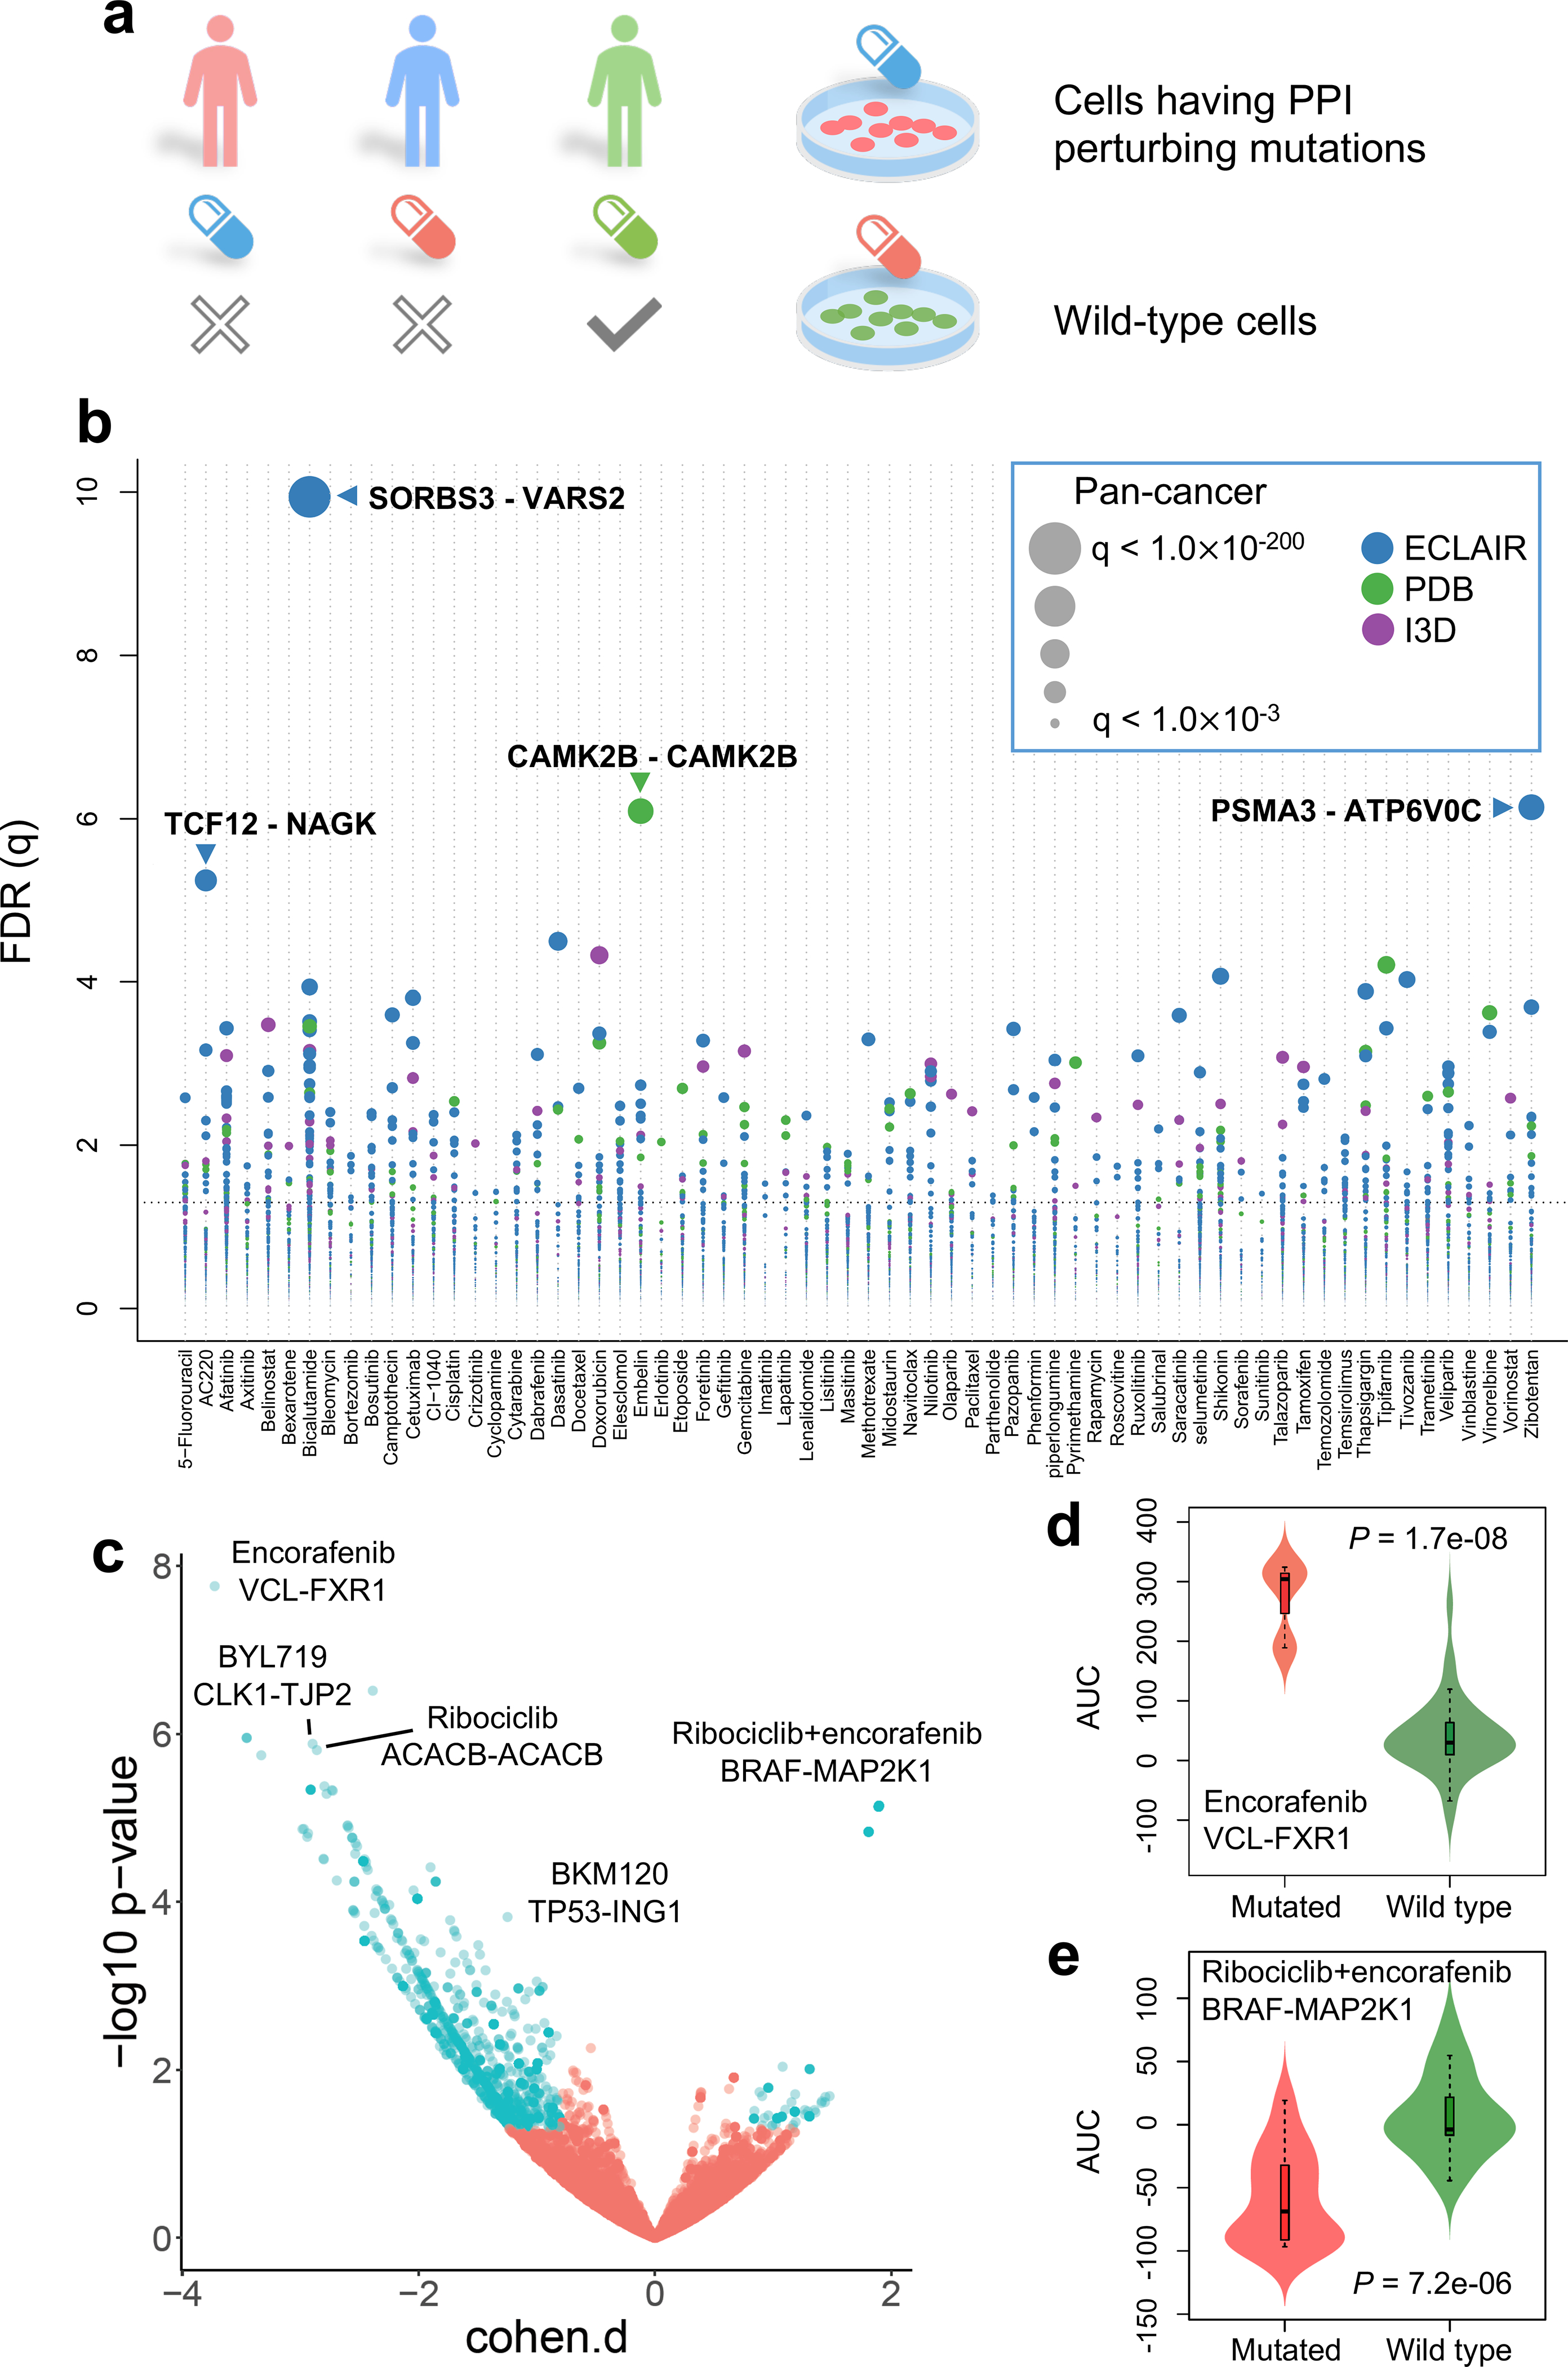
(a) Experimental design of pharmacogenomics predicted by PPI-perturbing alleles. (b) Drug responses evaluated by mutation-perturbed PPIs (putative oncoPPIs) which harbor a statistically significant excess number of missense mutations at PPI interfaces by following a binomial distribution across 66 selected anticancer therapeutic agents in cancer cell lines. Each node denotes a specific oncoPPI. The size of a node denotes the p-value levels computed by two-tailed ANOVA test (see Online Methods). The effect size was quantified through Cohen’s statistics using the difference between two means divided by a pooled standard deviation for the data. Color of nodes represents three different types of PPIs (see Figure 1c legend). (c) Drug responses evaluated by oncoPPIs in the Patient-Derived Xenograft (PDX) models. (d & e) Highlighted examples of drug response for encorafenib and its combinations (LEE011 and encorafenib) predicted by interface mutations on VCL-FXR1 (n=3 mutated cell lines; n=73 wild type cell lines) and BRAF-MAP2K1 (n=14 mutated cell lines; n=19 wild type cell lines), respectively. The p-value (P) was calculated by two-tailed ANOVA test. The data are represented as a boxplot with a underlaid violin plot where the middle line is the median, the lower and upper edges of the box are the first and third quartiles, the whiskers represent the interquartile range (IQR) ×1.5 and beyond the whiskers are outlier points.