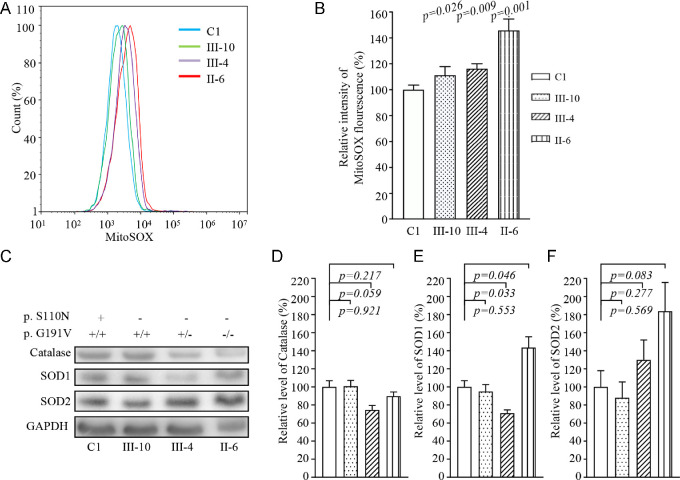
Figure 6.
Assays for mitochondrial ROS production. (A) Ratio of geometric mean intensity between levels of ROS generation in the vital cells. The rates of production in ROS from four cell lines were analyzed using a BD LSR II flow cytometer system with MitoSOX Red reagent (B) The relative ratio of intensity was calculated. The averages of three independent determinations for each cell line are shown. (C) Western blot analysis of antioxidative enzymes SOD2, SOD1, and catalase in six cell lines with GAPDH as a loading control. (D) Quantification of SOD2, SOD1, and catalase. Average relative values of SOD2, SOD1, and catalase were normalized to the average values of β-actin in various cell lines. The values for the latter are expressed as percentages of the average values for control cell line C1. The averages of three independent determinations for each cell line are shown. Graph details and symbols are explained in the legend to Figure 4.

