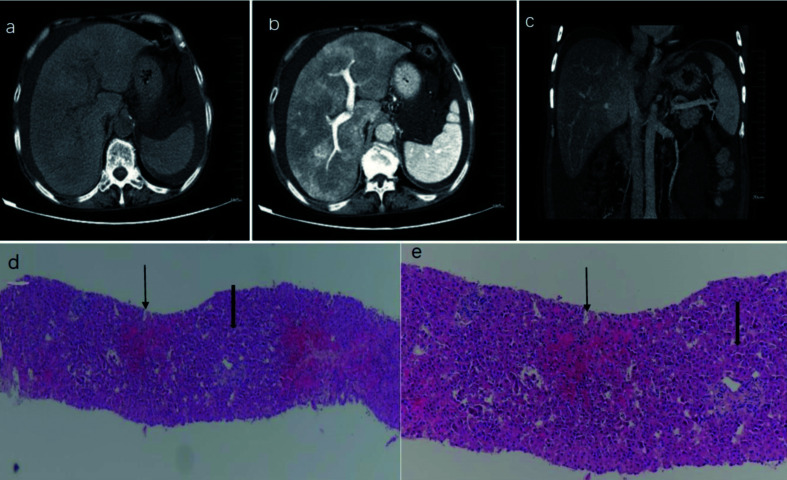
Fig. 2. Representative CT images and pathological findings for PA-HSOS patients.
(A) The CT imaging revealed diffuse hepatomegaly, ascites, and plain scans showing the heterogeneous decreased density of the hepatic parenchyma. (B) The CT enhancement characterized a map-like or mottle-like nonhomogeneous appearance in the equilibrium phase. (C) The CT images showed that the hepatic vein lumen was obscured, and the hepatic segment of the inferior vena cava was compressed and thinner. (D) hematoxylin-eosin (HE) ×40, Zone III, Zone I; (E) HE ×100, Zone III, Zone I. The pathological findings confirmed edema, necrosis, detachment of hepatic sinusoidal endothelial cells in hepatic acinus zone III, significant dilation and congestion of hepatic sinusoids, but showed no significant changes in zone I.

