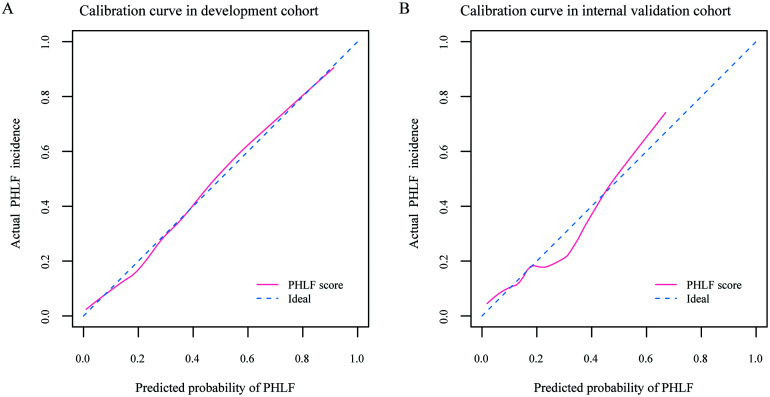
Fig. 4. Calibration curves for the prediction of PHLF.
Calibration curves of the PHLF score in (A) development cohort and (B) internal validation cohort. The diagonal blue dashed line represents a perfect prediction by an ideal model. The pink solid line represents the performance of the predictive model, of which a closer fit to the diagonal blue dashed line represents a better prediction. PHLF, post-hepatectomy liver failure.

