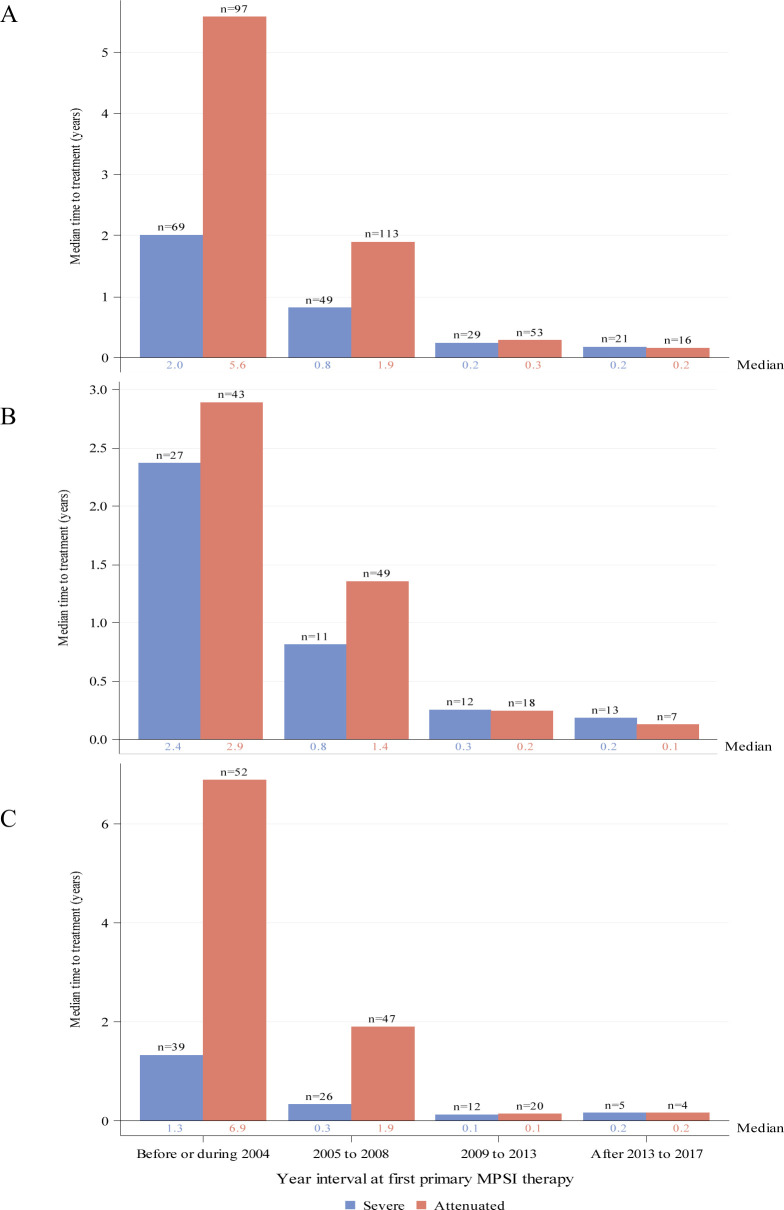
Figure 4.
Median duration from diagnosis to first ERT treatment by year interval for individuals with severe (blue) or attenuated (red) MPS I receiving ERT as primary therapy. Global distribution is shown in panel (A). Regional distributions are shown for North America (B) and Europe (C). Individual medians are shown at the base of each bar and individual n’s are shown at top of bars. ERT, enzyme replacement therapy; MPS I, mucopolysaccharidosis type I.

