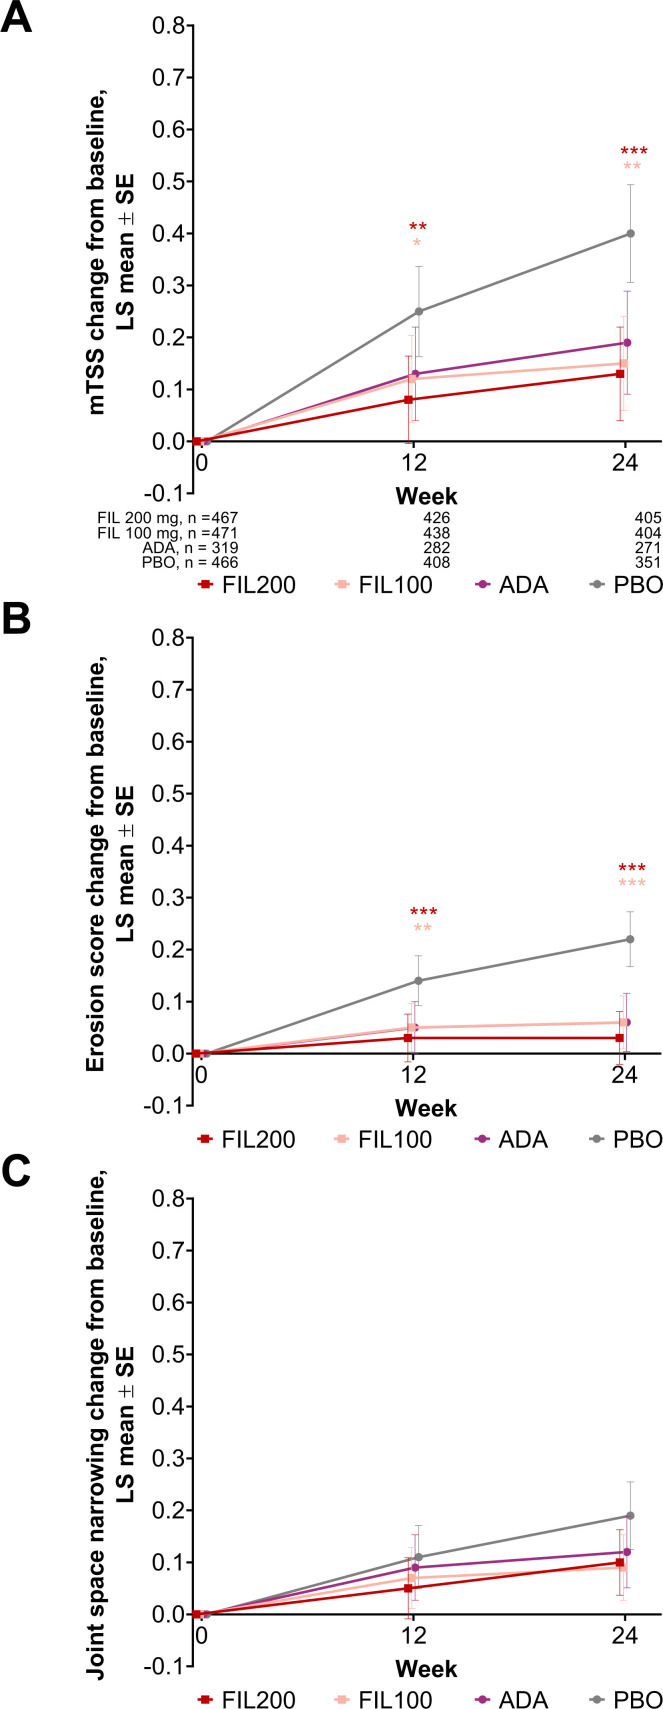
Figure 3.
Radiographic progression through week 24. (A) mTSS change from baseline, (B) erosion score change from baseline and (C) joint space narrowing change from baseline. Data from campaign A (through week 24) are shown. Supporting data are shown in online supplemental table S4. Patient numbers at each time point in (B) and (C) are the same as for (A). Error bars represent the SE of the LS mean. *p<0.05, **p<0.01, ***p<0.001 versus PBO, not adjusted for multiplicity and should be considered exploratory except for mTSS change from baseline following FIL200 and FIL100 versus PBO at week 24. Difference for mTSS change from baseline at week 24 following treatment with FIL200 or FIL100 versus ADA was explored and was not significant for either dose. ADA, adalimumab; FIL100, filgotinib 100 mg; FIL200, filgotinib 200 mg; LS, least-squares; mTSS, van der Heijde modified total Sharp score; PBO, placebo.

