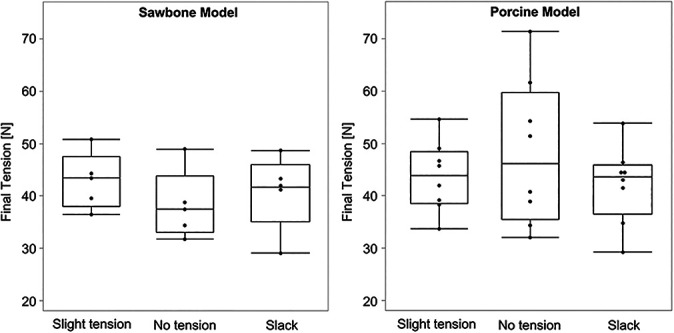
Figure 4.

Box plots depicted the final tension for each pretensioning condition for the (left) Sawbones model and the (right) porcine model. Black points indicate raw data values. Values are presented as median (line), interquartile range (box), and minimum and maximum (whiskers).
