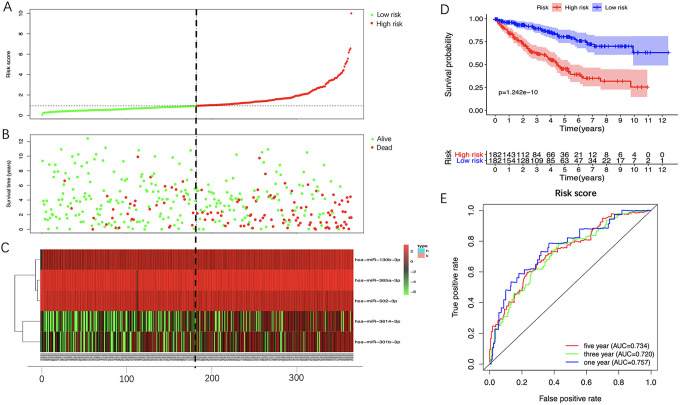
Figure 5.
Prognostic analysis of 5-miRNA signature in the training set. The dotted line represented the median risk score and stratified the ccRCC patients into low- and high-risk group. A, The curve of risk score. B, Survival status of the ccRCC patients. C, Heatmap of the expression levels of the 5 optimal Pr-miRNAs in low- and high-risk group. D, K-M survival analysis of the 5-miRNA signature. E, Time-dependent ROC analysis of the 5-miRNA signature. CcRCC indicates clear cell renal cell carcinoma; Pr-miRNAs, prognosis-related miRNAs; K-M, Kaplan-Meier; ROC, receiver operating characteristic.

