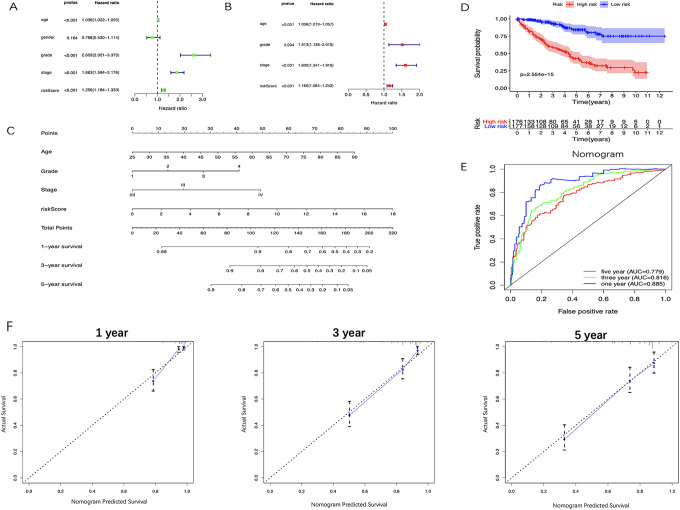
Figure 8.
Identifying the independent prognostic factors and construction of miRNA-based nomogram. A, Forrest plot of Univariate Cox regression analysis in ccRCC. B, Forrest plot of multivariate Cox regression analysis in ccRCC. C, Nomogram integrated 5 miRNA-based risk score, age, grade, and stage. D, The calibration plot of the nomogram for agreement test between 1-, 3- and 5-year OS prediction and the actual outcome. E, OS of the high-risk group was significantly worse than that of the low-risk group. F, Time-dependent ROC curves of the nomogram. CcRCC indicates clear cell renal cell carcinoma; OS, overall survival; ROC, receiver operating characteristic.

