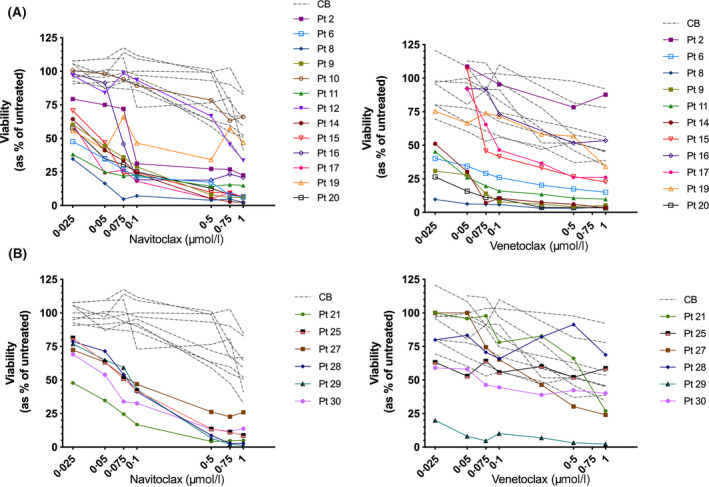
Fig 1.

Response of normal and acute lympohoblastic leukaemia (ALL) cells to B‐cell lymphoma‐2 (BCL‐2) inhibitors. (A) Response of B‐cell precursor (BCP) ALL (pts. 2, 6, 8, 9–12, 14–17, 19, 20) and normal CB (n = 9) to increasing doses of navitoclax and venetoclax for up to 48 h. (B) Survival of T‐cell (T‐)ALL (pts. 21, 25, 27–30) treated as above and compared to cord blood (CB). Symbols and lines represent individual patient responses. [Colour figure can be viewed at wileyonlinelibrary.com]
