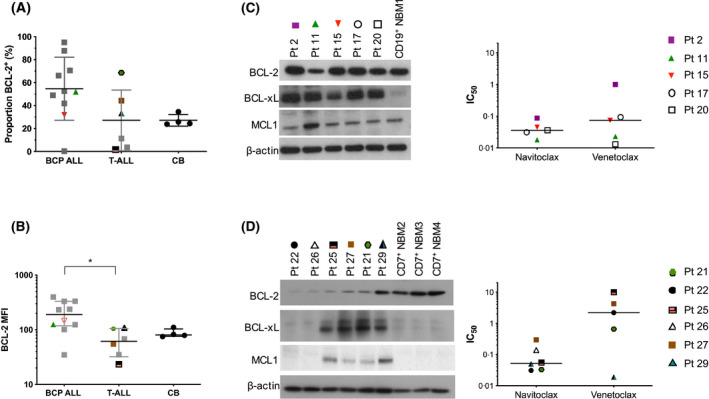
Fig 2.

Expression of B‐cell lymphoma‐2 (BCL‐2) in leukaemia and normal haemopoietic cells. (A) Proportion of BCL‐2+ cells and (B) median fluorescence intensity of BCL‐2 in 10 B‐cell precursor (BCP) acute lympohoblastic leukaemia (ALL) (pts. 6, 8, 9, 11–15, 18, 19), six T‐cell (T‐)ALL (pts. 21, 25, 27–30) and four cord blood (CB) samples. Symbols represent individual patient samples. Coloured symbols depict samples shown in panels (C) and (D). Lines in (A) represent mean ± standard deviation (SD). Lines in (B) represent median with interquartile range. *, P ≤ 0·05. (C, D) Expression of prosurvival proteins in BCP‐ (pts. 2, 11, 15, 17, 20) and T‐ALL (pts. 21, 22, 25–27, 29), respectively. BCP‐ALL samples were compared to CD19+ normal bone marrow (NBM) cells, while T‐ALL samples were compared to CD7+ NBM cells. The IC50 values for each patient sample for navitoclax and venetoclax are depicted in the graphs. Lines represent median values, symbols represent results from individual patient samples.
