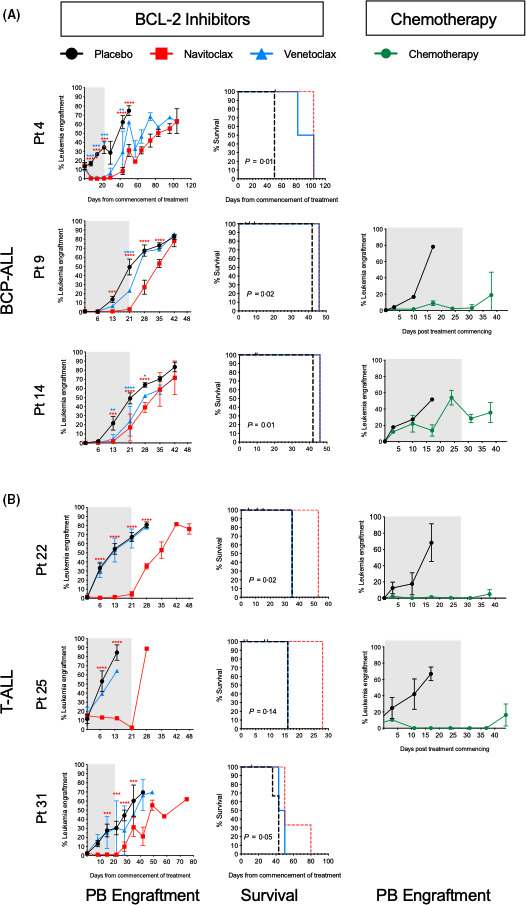
Fig 4.

Effect of B‐cell lymphoma‐2 (BCL‐2) inhibitors and standard therapeutics in vivo. NSG mice were transplanted with B‐cell precursor (BCP) acute lymphoblastic leukaemia (ALL) (pts. 4, 9, 14) (A) and T‐cell (T‐)ALL (pts. 22, 25, 31) (B). Engraftment levels in peripheral blood (PB) of NSG were monitored weekly by flow cytometry. Treatment with navitoclax or venetoclax or standard induction chemotherapeutics commenced when ≥0·5% human cells were detected in the PB (median time 16 days, range 11–60). At least three animals were used for each treatment group. The left and right panels show the number of leukaemia cells in murine PB over time from commencement of treatment (day 0). Grey boxes represent duration of treatment. Middle panel shows corresponding Kaplan–Meier survival curves for navitoclax‐ and venetoclax‐treated mice. Censored observations are depicted with black tick marks. Curves were compared using the log‐rank test. Data represent mean ± SD. Red asterisks correspond to comparisons between navitoclax‐ and placebo‐treated mice and blue asterisks between venetoclax‐ and placebo‐treated mice. *, P ≤ 0·05; **, P ≤ 0·01; ***, P ≤ 0·001; ****, P ≤ 0·0001. [Colour figure can be viewed at wileyonlinelibrary.com]
