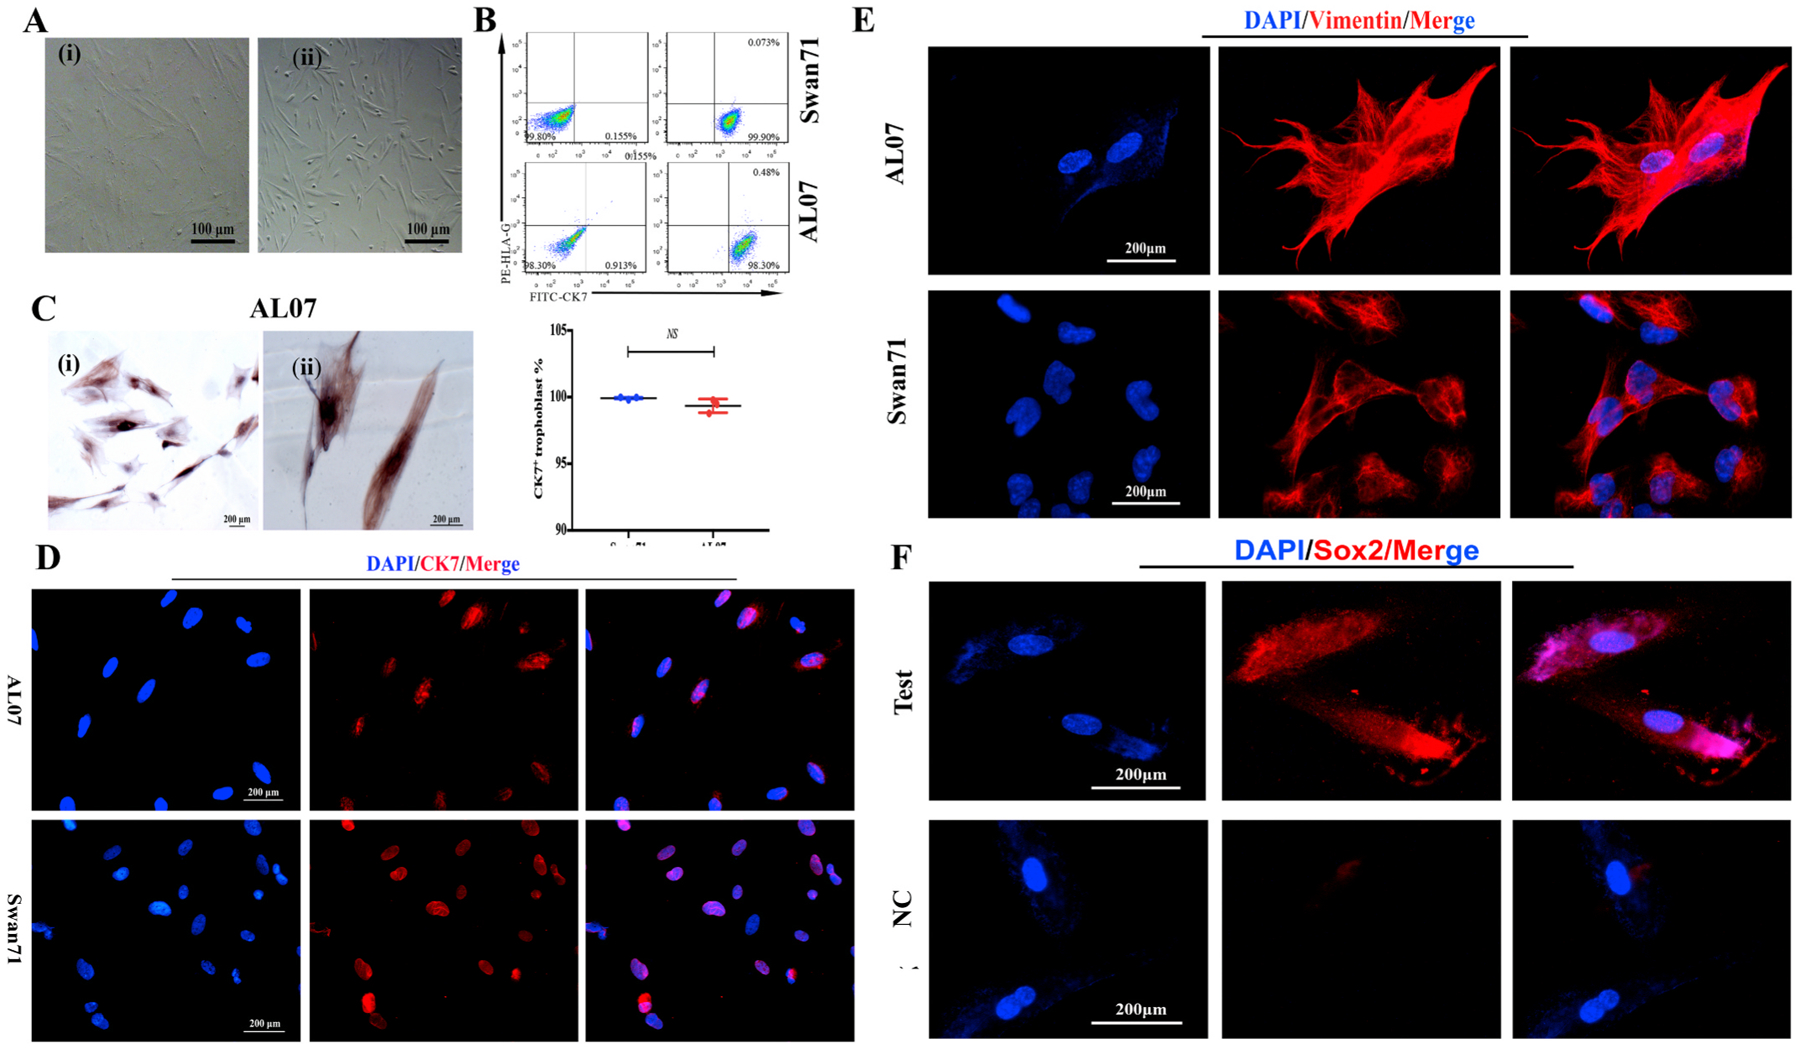
Fig. 2.

The purity of trophoblast cell lines AL07.
A: The images showed that AL07 cells were morphologically stable with passaging (i: passage 19 and ii: passage 33). B: The purity of the trophoblast cell line AL07 (lower panel) was evaluated by FCM using the specific marker CK7. Swan71 cell line served as positive controls (upper panel). HLA-G is a specific marker for extra-villous trophoblasts. Left panel was negative control(NC). CK7+cells were nearly 99% in AL07 cells and 100% in Swan71 cells. There were barely no CK7+HLA- G+cells in both cells lines. The purity of Swan71 and AL07 cell lines was identified by three independent experiments. The statistical result showed there was no significant difference between AL07 and Swan71 cells. Data are presented as the mean ± SD.The statistical result showed there was no significant difference between AL07 and Swan71 cells. C: CK7 was highly expressed in the cytoplasm and nucleus of AL07 cells, particularly in the nucleus by Immunocytochemistry. Original magnification ×200 (i) and ×400 (ii). Scale bars: 200 μm. D: Immunofluorescence staining was used to detect the trophoblast marker, CK7 expression in AL07 and Swan71 cell lines. Almost all the cells expressed CK7 with red signals in AL07 (upper panel) and Swan71(lower panel) cells, mainly in the nuclei. The Swan71 cell line was positive controls. Scale bars:200 μm. E: Immunofluorescence staining was performed to detect the expression of Vimentin in AL07 cells. Red signals of Vimentin was found in the cytoplasm of AL07 cells (upper panel), and similar to the positive control, Swan71 cells (lower panel). Scale bars: 200 μm. F: Immunofluorescence staining was performed to detect the expression of Sox2 in AL07 cells. Red signals of Sox2 was found in the nuclei and cytoplasm of AL07 cells (upper panel), and no signals was in negative control (lower panel). Scale bars: 200 μm.
