
Figure 6: VEO-IBD gene expression in intestinal single-cell RNA-seq.
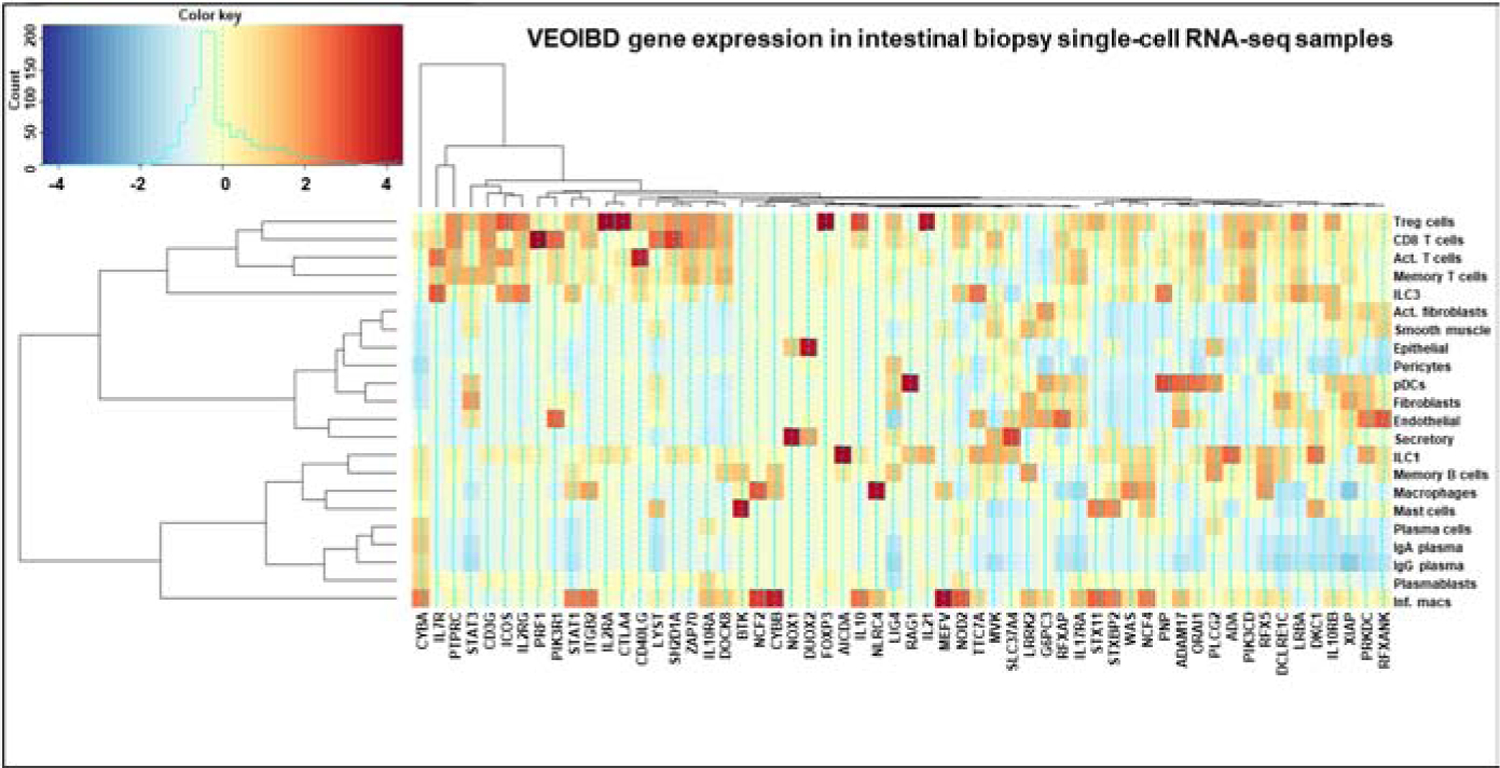
Average expression across each cell type cluster is shown, based on sorting using Seurat 3.0. Genes and cell types clustered based on similarity of expression among the VEO-IBD genes plotted.