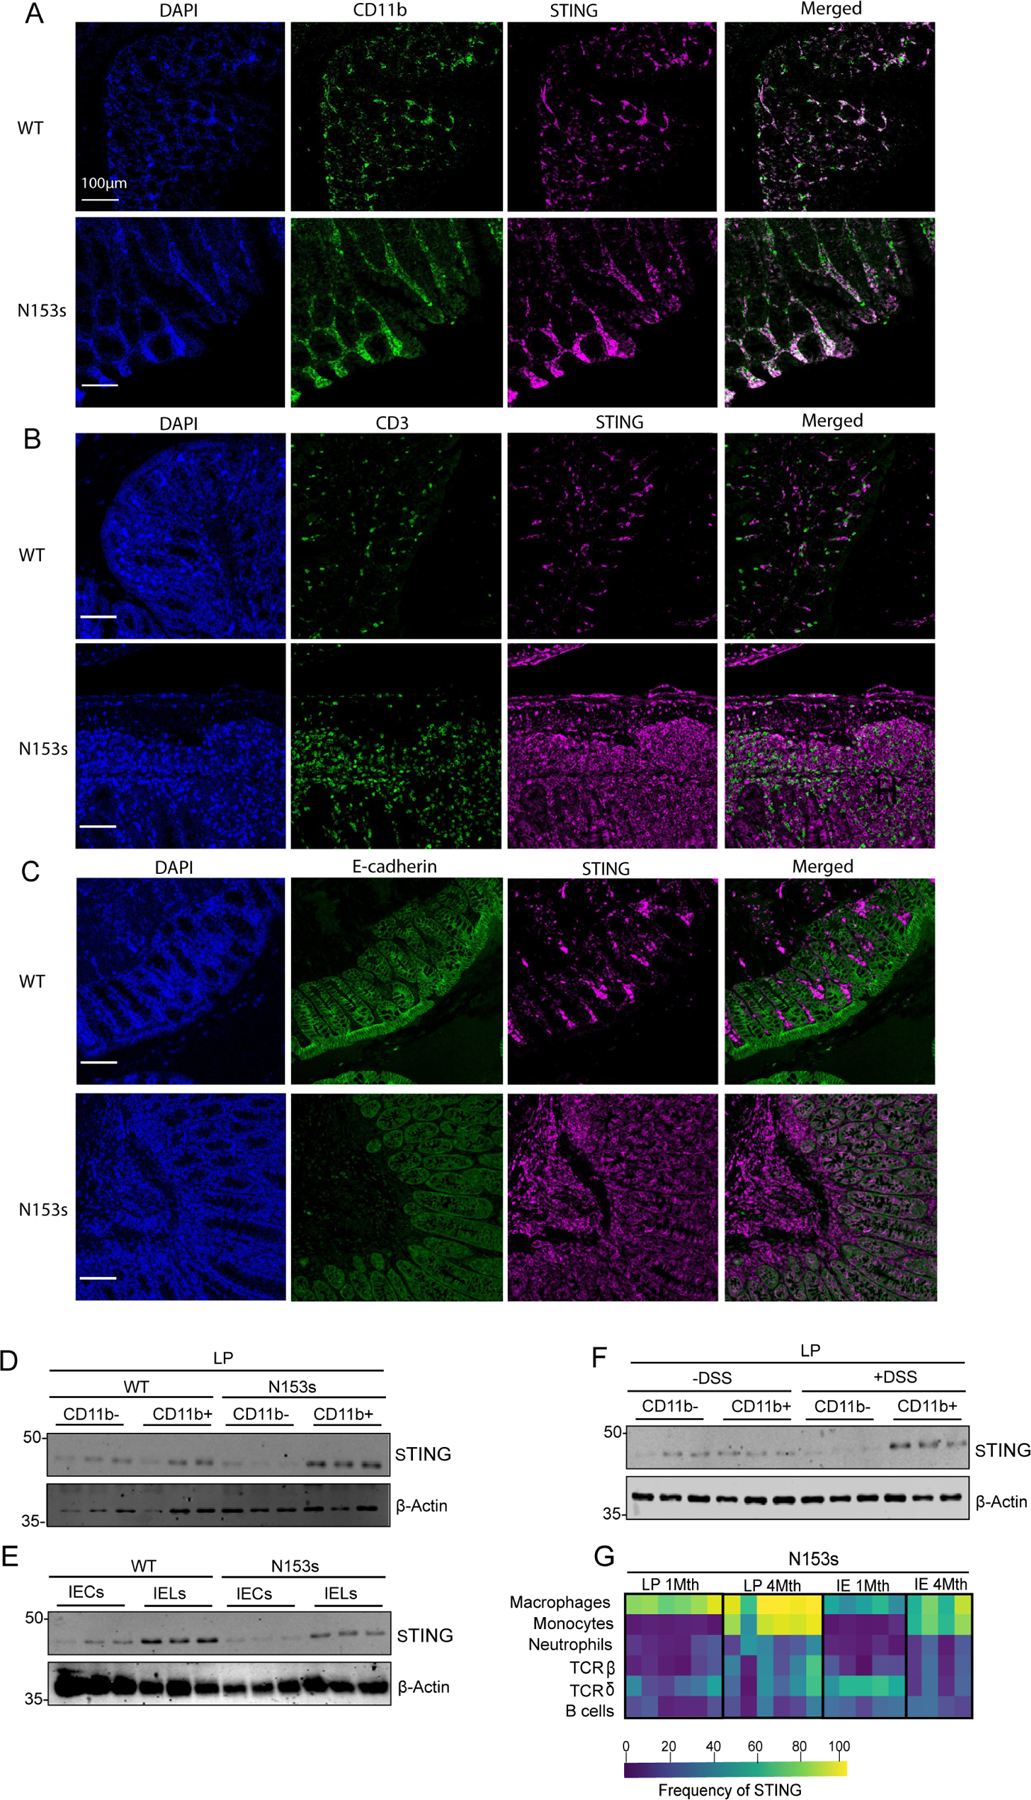
Figure 3. STING protein primarily expresses and accumulates in resident intestinal macrophages and proinflammatory monocytes during intestinal inflammation.

(A-C) Representative images of cellular localization of STING and (A) CD11b+ cells, (B) CD3 cells and (C) IECs (E-cadherin) in WT and N153s mice observed by confocal microscopy. Cells were probed with DAPI (left panels, blue), Opal 480-labeled CD11b+, Opal 480-labeled CD3 or FITC conjugated E-cadherin antibody as indicated (second left panels, green). Cells were co-stained with Opal 690-labeled STING (magenta, second right). Merged images of STING and the indicated cell populations are shown in the right panels. Scale bars, 100μm. Representative images of Western blotting detecting STING in indicated colonic cell populations isolated from (D-E) N153s and WT littermate control mice at 4.5 months of age and (F) WT mice challenged with 2% DSS for 7 days. Equal loading was detected by measuring β-actin. (G) Heat-map representing frequency of cells expressing STING in colonic LP and IE immune cells of each cell subset of N153s mice at the indicated age, quantified by flow cytometry (Data are represented as mean ±SEM of n=2–3 from 3–4 independent experiments).
