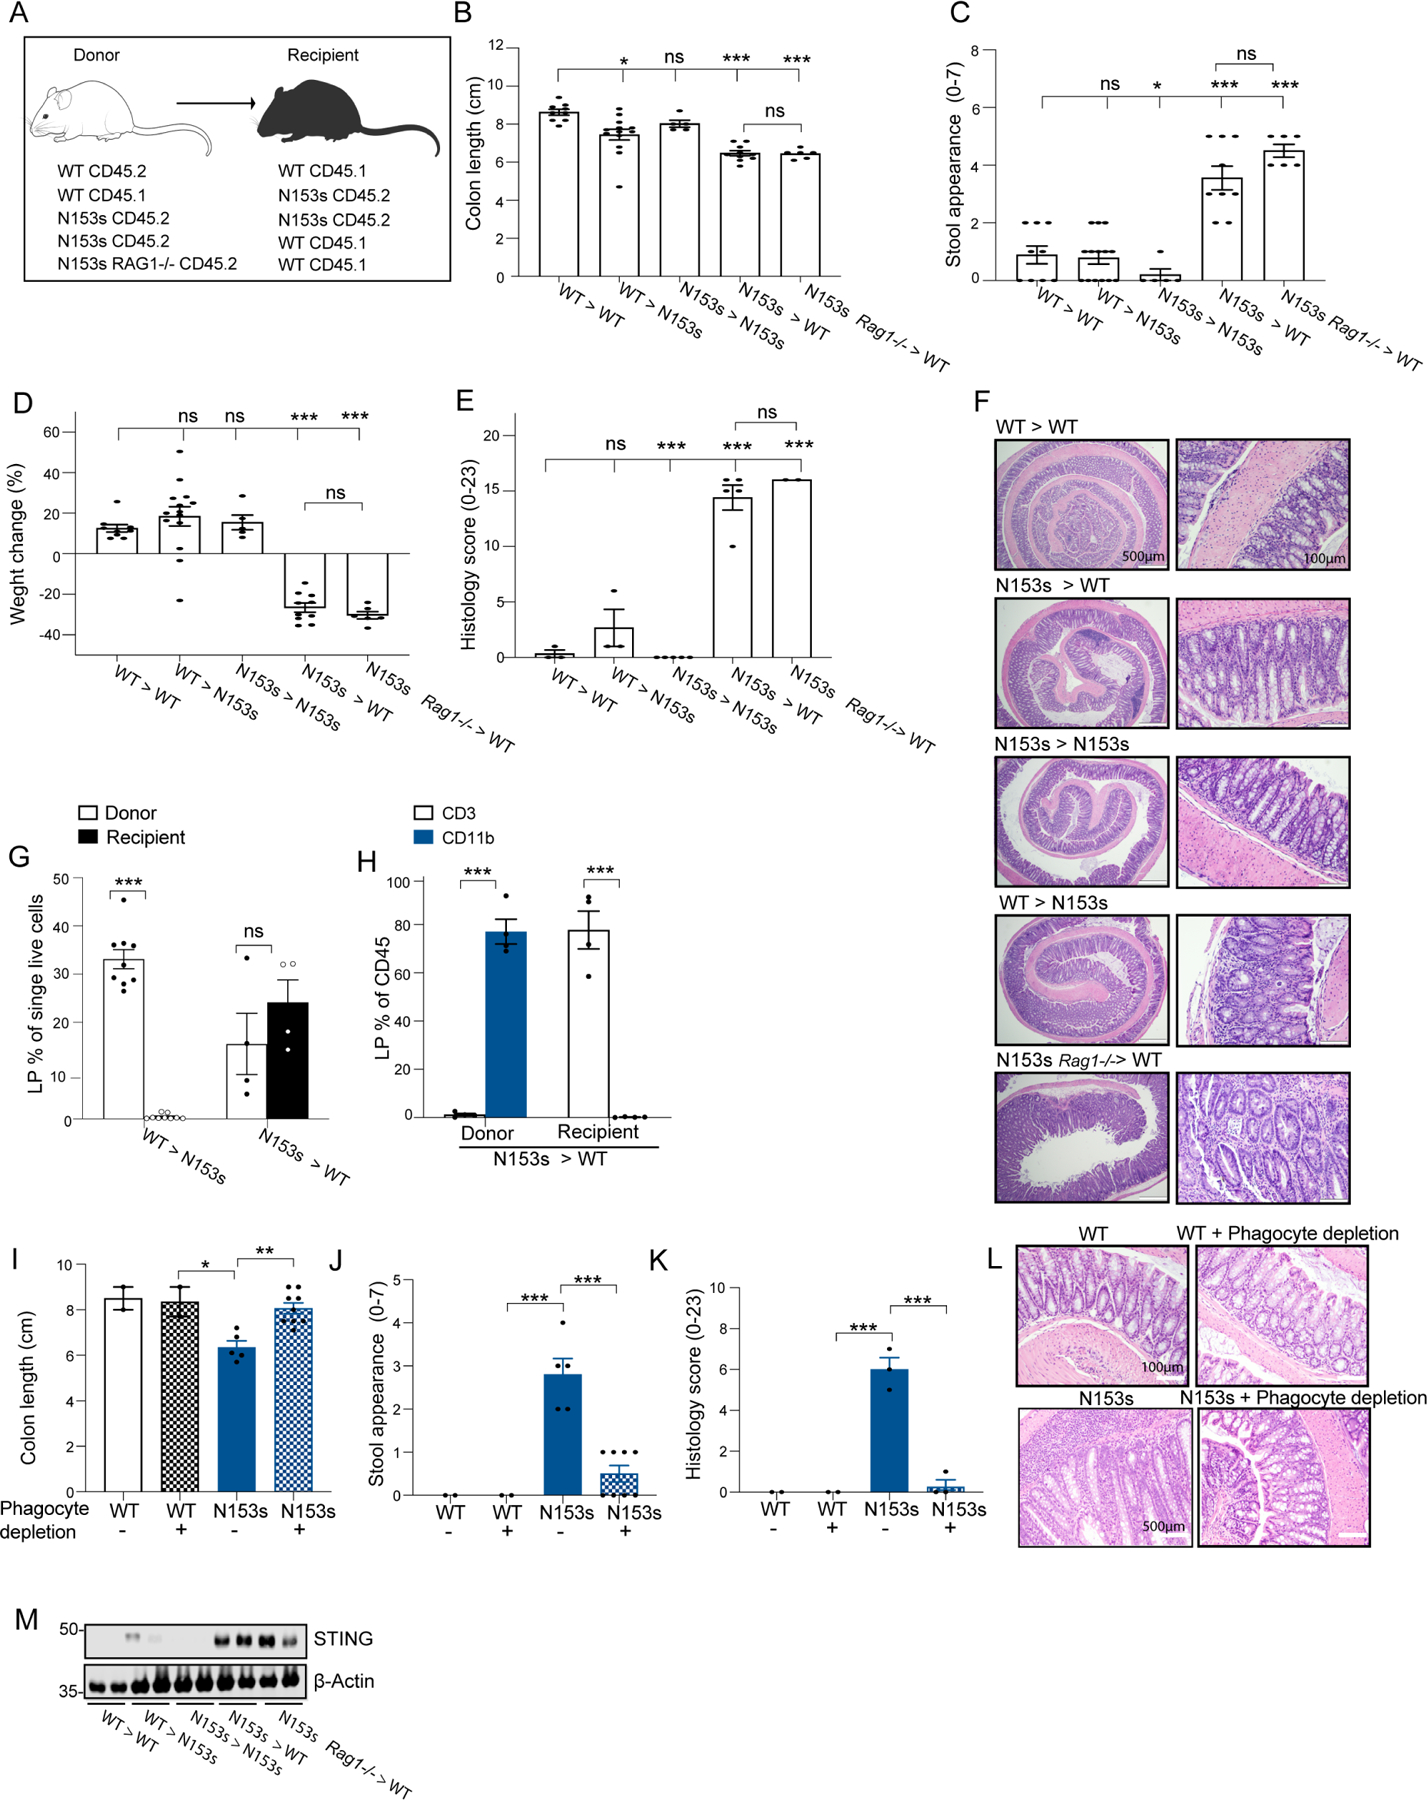
Figure 4. Intrinsic activation of STING in myeloid cells drives intestinal inflammation.

(A-I) Bone marrow chimera experiments of the indicated irradiated (900R) mice reconstituted with 107 bone marrow cells from donor mice. WT CD45.2 > WT CD45.1, WT CD45.1 > N153s CD45.2, N153s CD45.2 > N153s CD45.2, N153s CD45.2 > WT CD45.1 and N153s RAG−/− CD45.2 > WT CD45.1 mice. (A) Schematic image illustrating chimera experiment design. Graphical summary of (B) colon length, (C) stool appearance, (D) weight change and (E) pathology score of the indicated mice 6 weeks post-reconstitution (*P<0.05, **P<0.01, ***P<0.001. Data are represented as mean ±SEM of n=2–9 from 2 independent experiments). (F) Representative images of H&E-stained colon sections from the indicated mice. (G) Flow cytometry analysis of LP donor and recipient cells presented as % out of single live cells of the indicated chimera mice. (H) Flow cytometry analysis of LP CD3+ and CD11b+ cells presenting as % out of donor and recipient cells of N153s > WT chimera mice. (***P<0.001. Data are represented as mean ±SEM of n=2–5 from 2 independent experiments). (I) Colon length, (J) stool appearance, (K) pathology score and (L) representative H&E images of colon sections of the indicated mice at 2-months of age. (*P<0.05, **P<0.01, ***P<0.001. Data are represented as mean ±SEM of n=2–4 from 2 independent experiments). (M) Immunoblot analysis of STING and β-actin in colon tissue lysates of the indicated mice.
