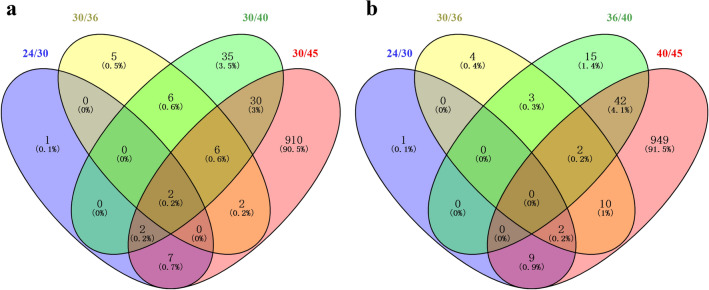
Fig. 5.
Venn diagram of differential expressed genes of ZM4 cultured at 24 °C compared with 30 °C (24/30), ZM4 cultured at 30 °C compared with 36 °C (30/36), ZM4 cultured at 30 °C compared with 40 °C (30/40), and ZM4 cultured at 30 °C compared with 45 °C (30/45) (a). Venn diagram of differential expressed genes with the raise of temperature gradually for ZM4 cultured at 24 °C compared with 30 °C (24/30), ZM4 cultured at 30 °C compared with 36 °C (30/36), ZM4 cultured at 36 °C compared with 40 °C (36/40), and ZM4 cultured at 40 °C compared with 45 °C (40/45) (b)

