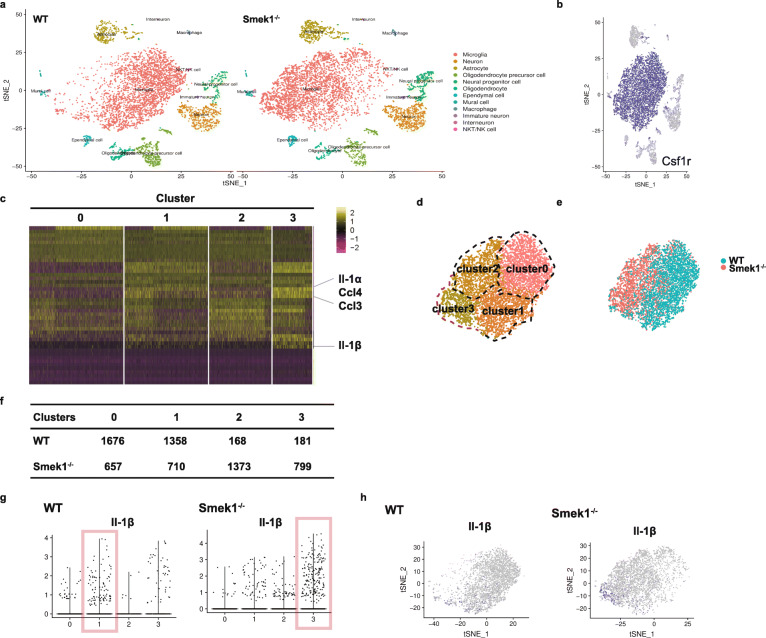
Fig. 3.
Single-cell RNA-seq of the brain cortex and hippocampus reveals hyperactivated microglia in Smek1-/- mice. a tSNE visualization of individual cell clusters from the cortex and hippocampus of wild-type (n = 2) (left panel) and Smek1-/- (n = 2) (right panel) mice. b tSNE plots highlighting the marker gene Csf1r for microglia. c Heatmap of total microglial subclusters. d Microglia are divided into 4 clusters according to diverse transcriptional patterns, namely, clusters 0 to 3. e Contribution of wild-type versus Smek1-/- mouse samples to microglial cell clusters. f Cell number of microglial clusters in different genotypes. g Violin plots representing the distribution of the log-transformed normalized gene expression of IL-1β in microglia (clusters 0–3). The red box represents proinflammatory microglia. h tSNE map representing the distribution of the log-transformed normalized gene expression of IL-1β in microglia (clusters 0–3)

