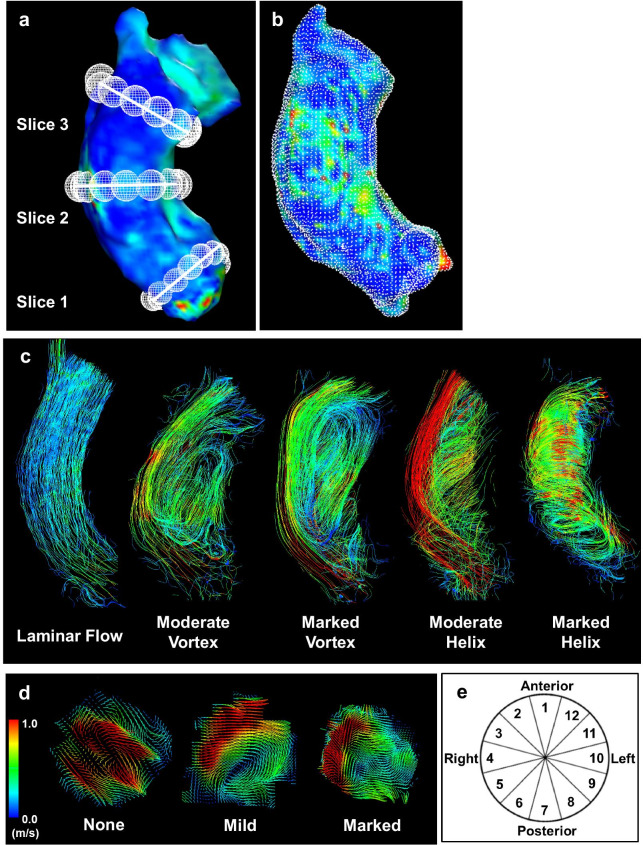
Fig. 2.
Methodological diagrams. a Position of analysis planes in the AAo at the level of the sinotubular junction (Slice 1), mid AAo (Slice 2), and proximal to the brachiocephalic trunk (Slice 3). b WSS calculation in the entire AAo. WSS is calculated at each white dot. c Laminar flow and examples of grading for vortical and helical flow. d Peak systolic blood flow velocity map at the level of the mid AAo exhibits blood flow eccentricity. e Cross section of the AAo shows segments along the aortic wall circumference. AAo ascending aorta, WSS wall shear stress

