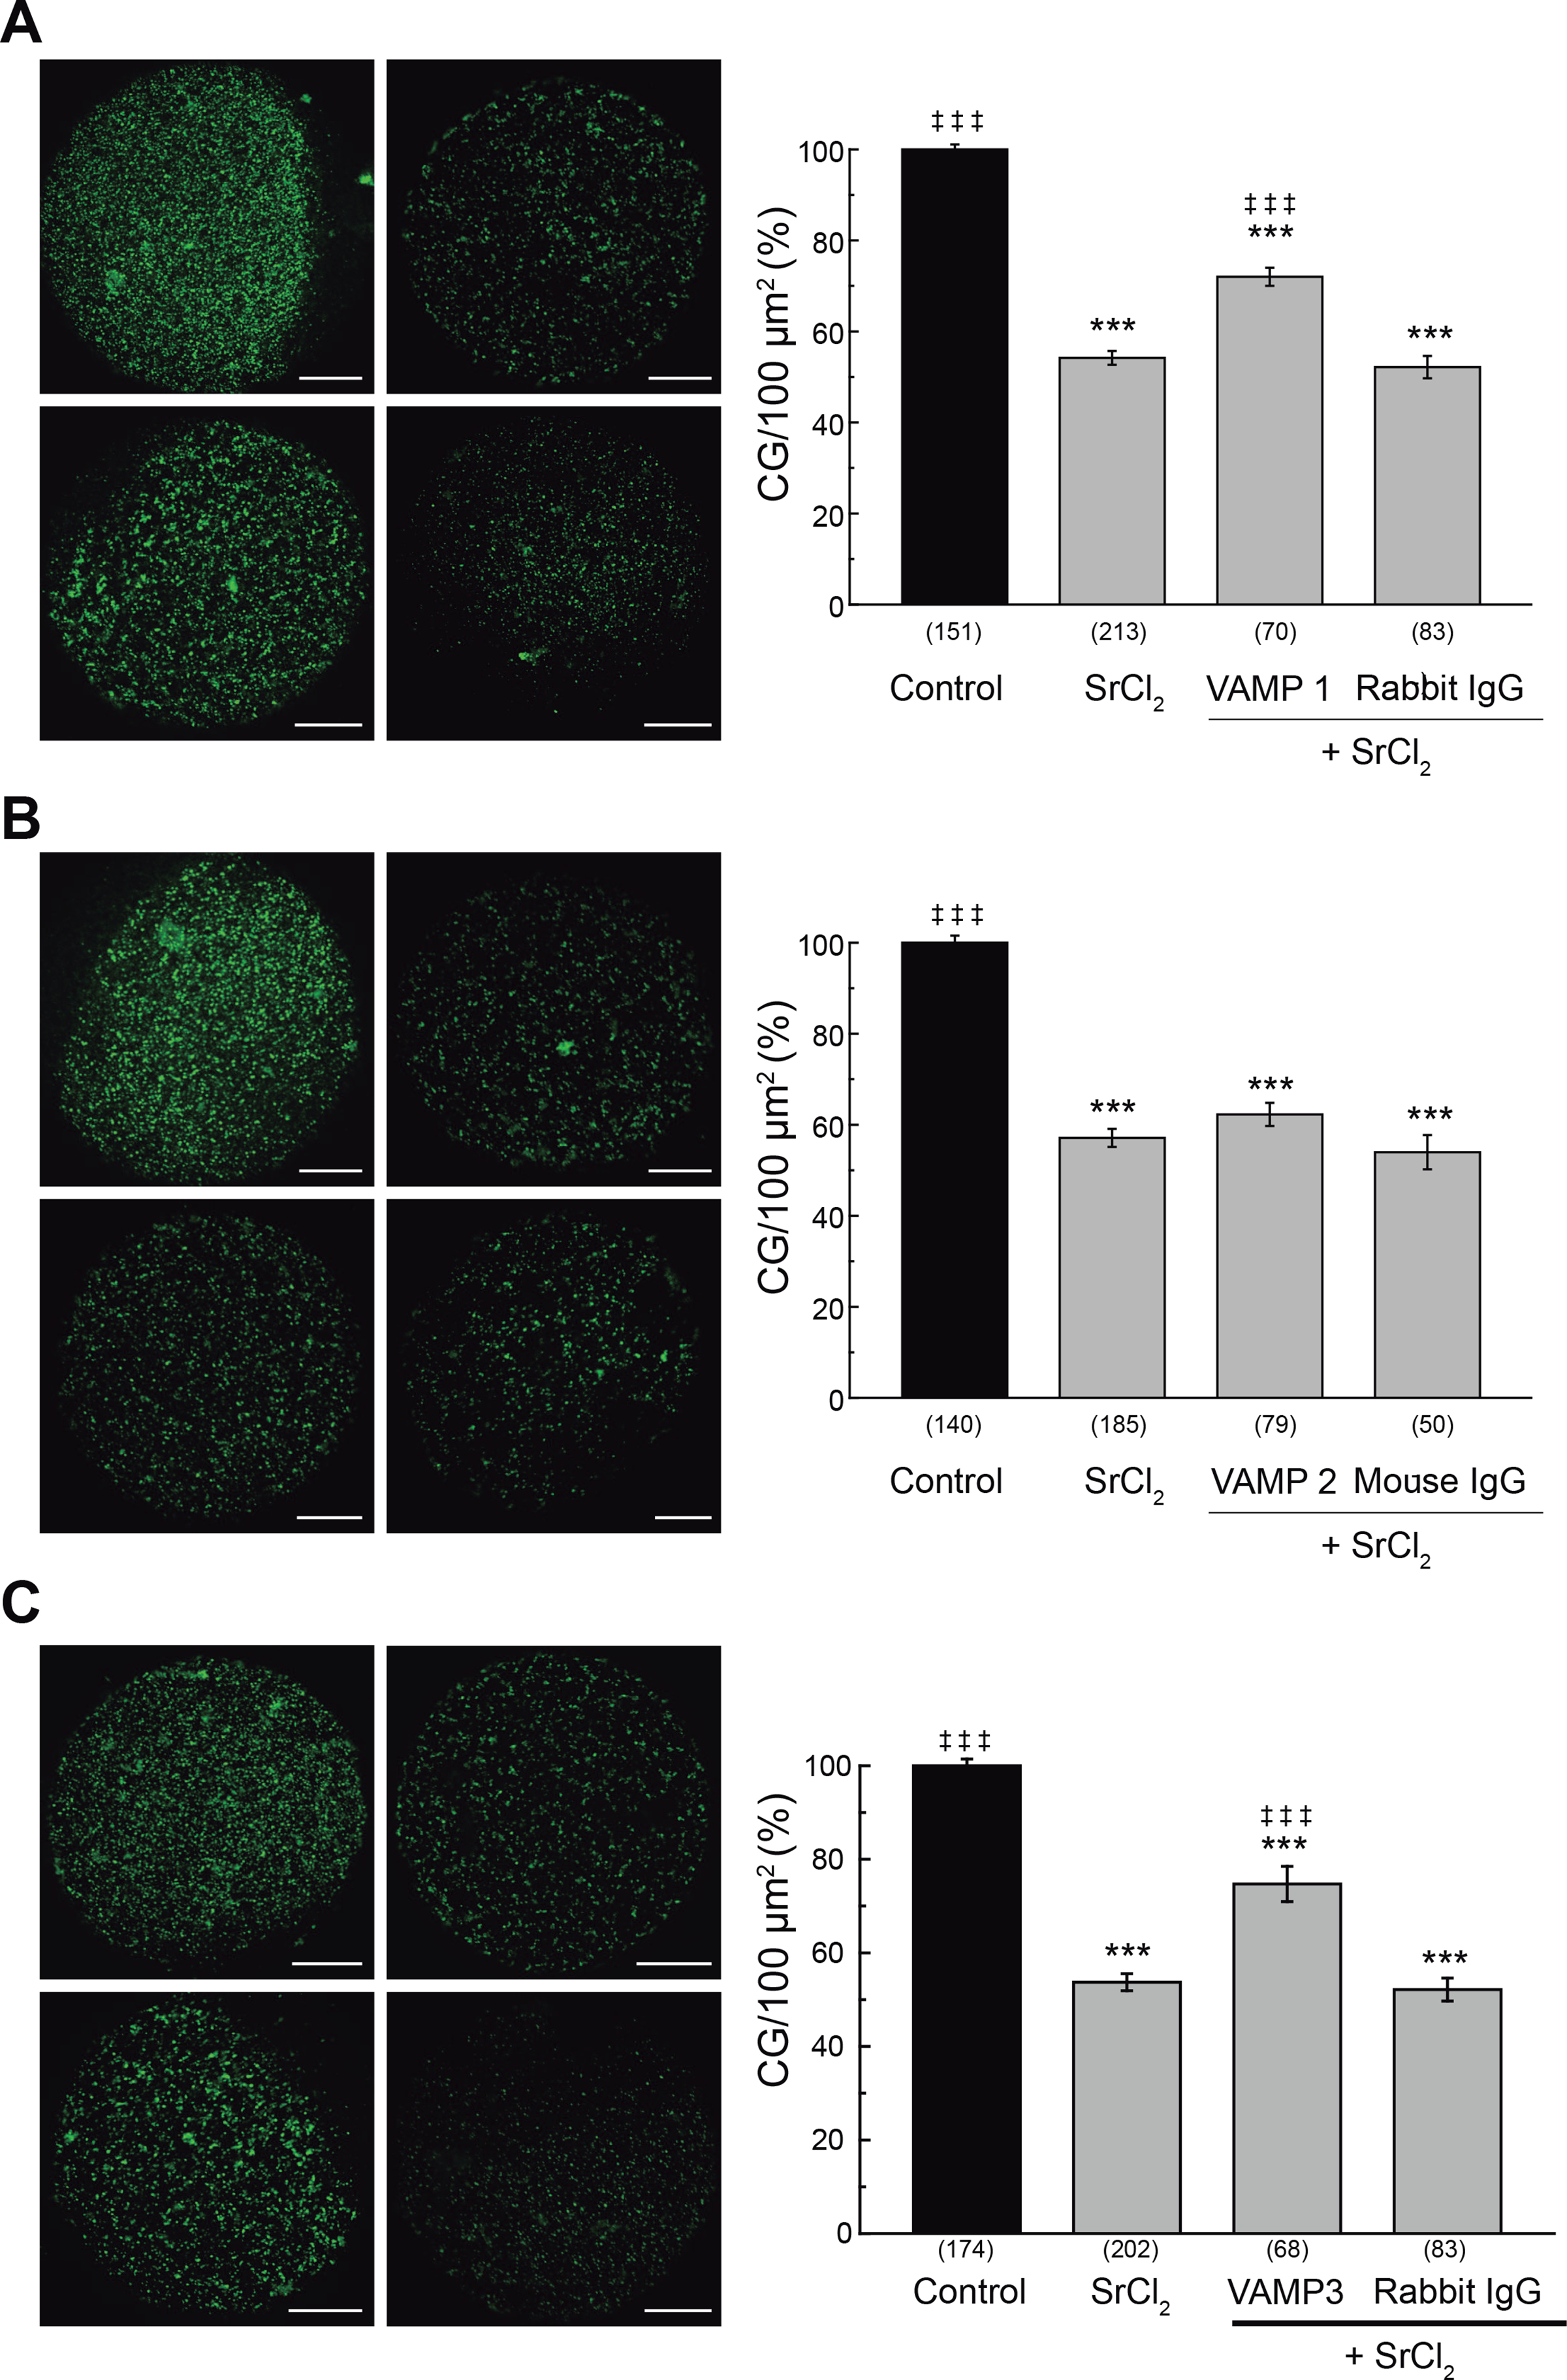
Figure 4. Effect of microinjection of anti-VAMP1, anti-VAMP2 and anti-VAMP3 antibodies on cortical granule exocytosis.

Oocytes were microinjected with either anti-VAMP1 (A), anti-VAMP2 (B), or anti-VAMP3 (C) antibodies (1 μg/μl) and the cortical reaction was triggered with 30 mM SrCl2. Rabbit or mouse IgG were microinjected as isotype controls. Images were taken as described in M&M. Left, for each panel: representative confocal microscopic images of oocytes stained with FITC-LCA. Scale bar: 20 μm. Right, for each panel: histogram showing CG density/100 μm2 for different treatments and relative to untreated group (Control) set as 100%. Data are shown as mean ± SEM from at least 3 independent experiments. Numbers in parentheses below bars represent total number of oocytes. ***, values compared to control (without stimulus), p ≤ 0,001; ‡ ‡ ‡, values compared to SrCl2, p ≤ 0,001. Statistical tests: One way ANOVA and Tukey’s test.
