Fig. 3.
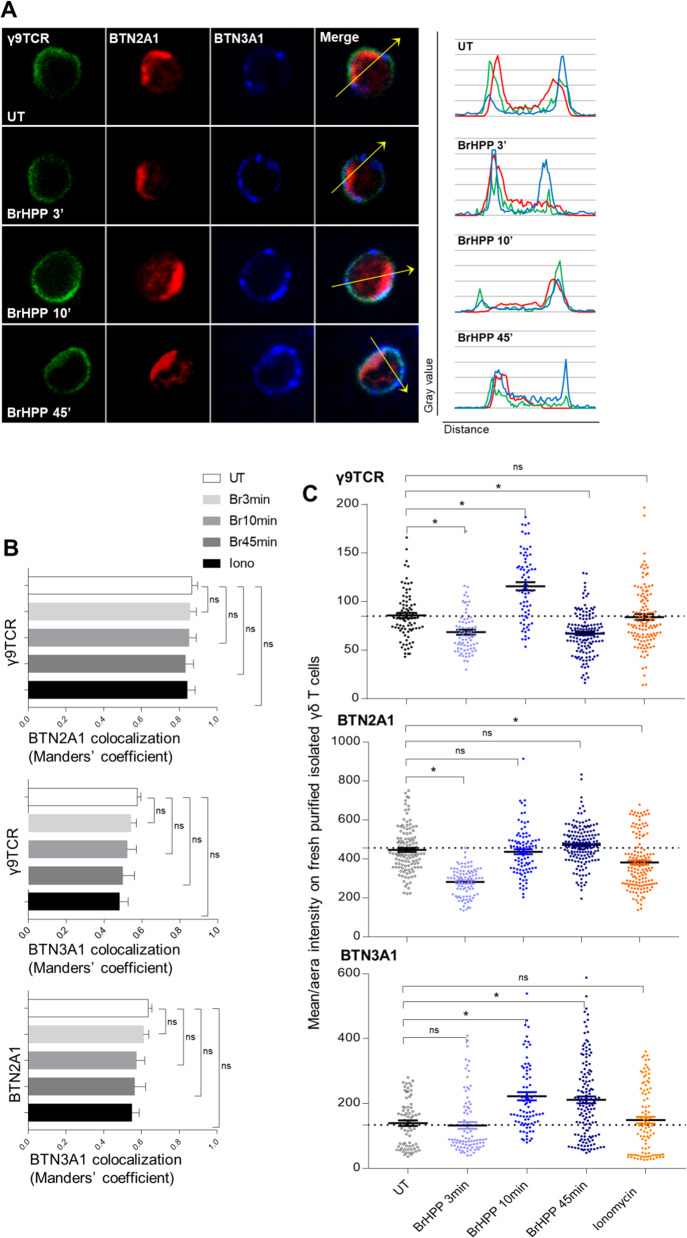
Preexisting clusters of γ9TCR, BTN2A1 and BTN3A1 at the surface of resting Vγ9Vδ2 T cells and their modulation during BrHPP stimulation. A Immunofluorescence of γ9TCR, BTN2A1 and BTN3A1 on freshly purified isolated Vγ9Vδ2 T cells during BrHPP stimulation (representative images, γ9TCR: green fluorescence, BTN2A1: red fluorescence and BTN3A1: blue fluorescence and the merge) and colocalization profiles for each condition corresponding to the arrow). B Comparison of the colocalization of γ9TCR, BTN2A1 and BTN3A1 on freshly purified isolated Vγ9Vδ2 T cells during BrHPP or ionomycin stimulation quantified by Manders’ coefficient in ImageJ software. C Mean/area intensity of γ9TCR, BTN2A1, and BTN3A1 on freshly purified isolated Vγ9Vδ2 T cells during BrHPP or ionomycin stimulation. Asterisk (*) indicates p < 0.05, Student’s paired t test; ns not significant

