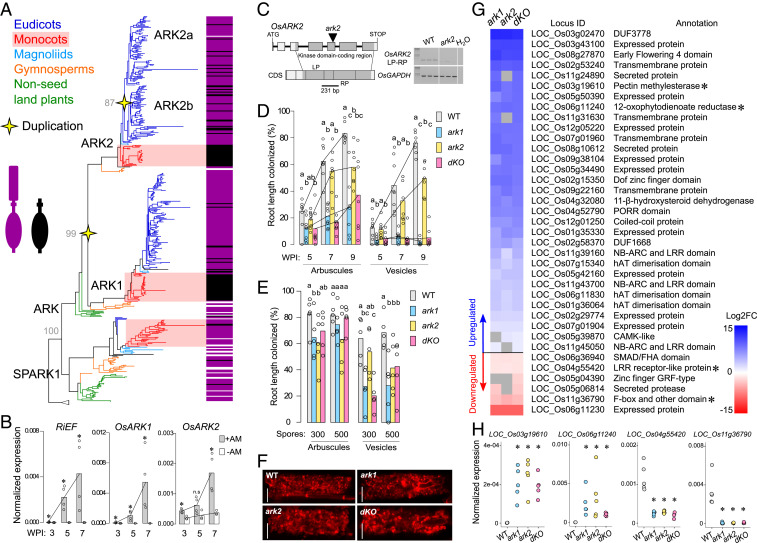
Fig. 1.
Identification and characterization of OsARK2. (A) Phylogenetic tree of the URK-2 RLK subfamily. Bootstrap values of important nodes are shown. Occurrence of the ED was surveyed for each sequence, purple denoting presence and black absence. White accounts for incomplete sequences where occurrence of the ED could not be established. A detailed tree is available in Dataset S1. (B) Comparative gene expression assay in a time course of wild-type rice. Expression levels of Rhizophagus irregularis ELONGATION FACTOR (RiEF) are included to account for increases of AM fungal biomass over time. Expression levels in inoculated (+AM) and noninoculated (−AM) roots are normalized to OsCYCLOPHILIN2. Bars represent means. Asterisks denote statistically significant differences between +AM and −AM treatments (Kruskal–Wallis and post hoc Dunn’s test P < 0.05). (C) Gene structure of OsARK2. Tos17 element is inserted between the first and second nucleotide of the codon encoding the universal Asp residue from the kinase domain catalytic loop in exon V (978 base pairs from first nucleotide of ATG). Right: RT-PCR shows no transcripts in ark2 using oligonucleotides spanning Tos17 insertion. (D) Time course colonization assay employing 250 R. irregularis spores as inoculum. (E) Colonization assay under different inoculum pressures evaluated at 6 wk postinoculation (WPI). For D and E, bars represent means and different letters denote statistically significant differences between genotypes (Kruskal–Wallis and post hoc Dunn’s test P < 0.05). (F) Confocal microscope images of fully developed arbuscules stained with wheat germ agglutinin (WGA)-Alexa Fluor 633. (Scale bar, 10 μm.) Representative images per genotype are provided. (G) Subset of DEGs from the RNA-seq assay that displayed a strict nonoverlapping expression pattern in the WT-dKO comparison. Color hue accounts for degree of up- or down-regulation compared to the WT (log2FC ≥ |1|, FDR adjusted P ≤ 0.05). Gray squares represent no expression changes in the respective genotypes. Asterisks mark genes selected for validation. (H) qRT-PCR assays confirming the pattern of expression of a subset of DEGs in an independent experiment. Expression levels are normalized to OsCYCLOPHILIN2. Asterisks denote statistically significant differences between gene expression of mutant genotypes and WT control (Kruskal–Wallis and post hoc Dunn’s test P < 0.05). FC, fold change. n.s., statistically nonsignificant.

