Fig. 1.
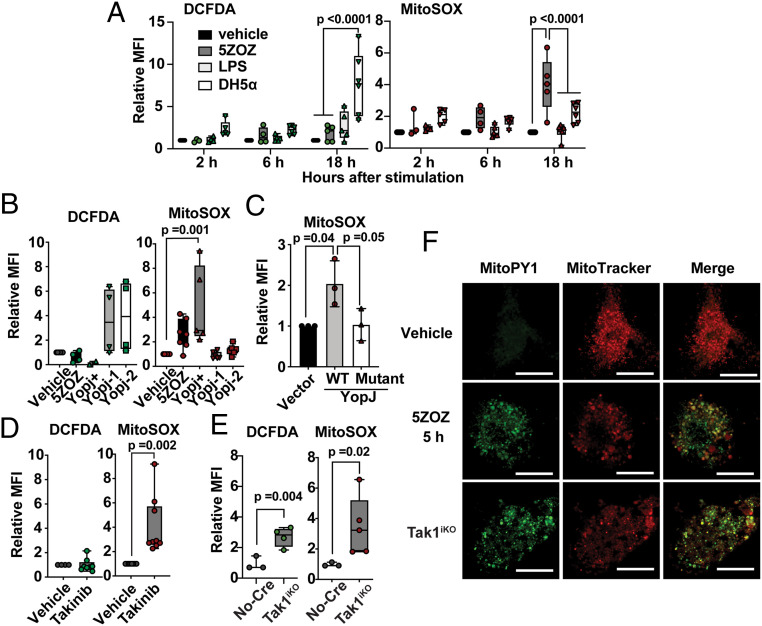
Mitochondrial ROS are induced by TAK1 inhibition but not by PRR stimulation. (A) BMDMs were treated with 300 nM 5ZOZ, 100 ng/mL LPS, or E. coli DH5-α. DH5-α number was used at 100-fold of the BMDM number. Cells were harvested at 2, 6, and 18 h post treatment and were incubated with CM-H2DCFDA (DCFDA) and Sytox Red (cell viability dye) or with MitoSox and Sytox Green (cell viability dye). The median fluorescence intensity (MFI) of live cells was determined. Data include all separately acquired data points in BMDMs from three different animals are shown as fold-inductions relative to vehicle-treated samples. (B) Yersinia strains expressing YopJ (YopJ+) and two strains with no yopJ gene (YopJ-1 and YopJ-2) were infected into BMDMs, and ROS levels were determined at 18 h post infection. (C) Wild-type YopJ and acetyltransferase-dead mutant YopJ (YopJ mutant) were expressed in HeLa-RIPK3 cells. At 24 h post transfection, cells were treated with 50 ng/mL TNF, and ROS levels were analyzed only in transfected and live cells at 48 h post transfection. (D) BMDMs were treated with 10 µM Takinib for 18 h, and ROS levels were analyzed. (E) No-Cre control Tak1flox/flox and inducible Tak1-deficient (Tak1iKO) BMDMs were treated with the Cre inducer (4OHT) for 5 d. All data points acquired form different animal-derived BMDMs are shown. (F) BMDMs were treated with vehicle or 300 nM 5ZOZ for 5 h (Top and Middle). Tak1iKO BMDMs were treated with 4OHT for 5 d (Bottom). Mitochondrial ROS dye MitoPYI and MitoTracker Red staining are shown. (Scale bars, 20 µm.) One-way ANOVA, multiple comparisons, Tukey test (A–C), and unpaired Student’s’ t test (D and E).

