Fig. 4.
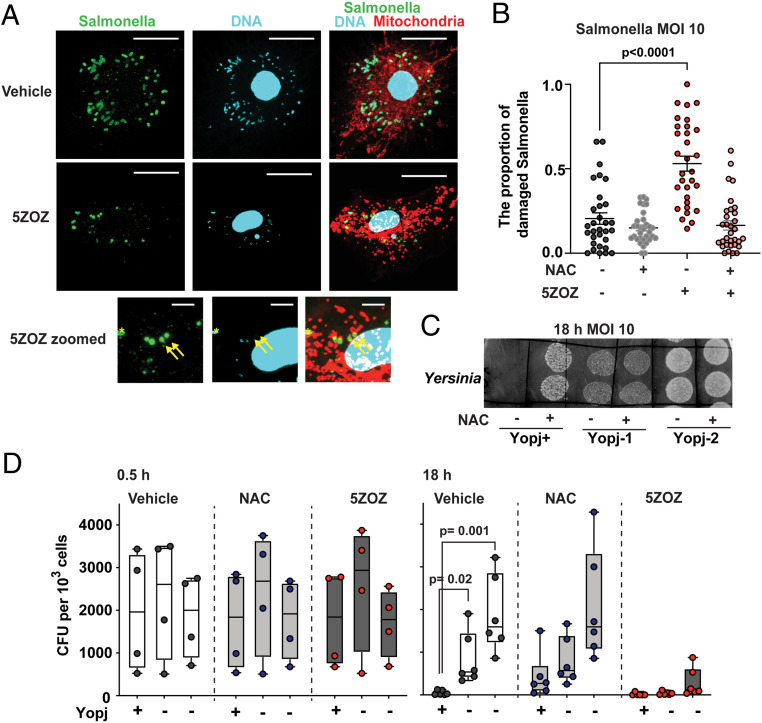
Intracellular Salmonella and Yersinia. (A and B) TAK1 inhibition destroys intracellular Salmonella. BMDMs were infected with Salmonella, MOI of 10, and were treated with 300 nM 5ZOZ and/or 3 mM NAC. Cells were incubated with MitoTracker Red at 18 h post infection. Intracellular Salmonella was visualized by immunofluorescence staining of anti-Salmonella. Bottom shows enlarged pictures of the 5ZOZ-treated cell. Yellow arrows indicate damaged Salmonella having no DNA. Yellow asterisk indicates an intact Salmonella cell. (Scale bars, 20 µm in Top and Middle; 5 µm in Bottom.) Quantification of the proportion of damaged intracellular Salmonella is shown in B. Each data point represents one BMDM cell. Data from 30 cells per each treatment in three independent animal-derived BMDMs are shown. (C and D) One YopJ-expressing and two yopJ-deficient Y. enterocolitica strains were infected in BMDMs (MOI of 10). Bacteria colonies of two technical replicate spots from intracellular Yersinia at 18 h post infection with and without 3 mM NAC are shown (C). The bacteria number was quantified at the initial invasion, 30 min (D, left graphs), and at the intracellular maintenance/proliferation phase, 18 h (D, Right graphs). One-way ANOVA, multiple comparisons, and Tukey test (B); unpaired two-way Student’s’ t test (D).

