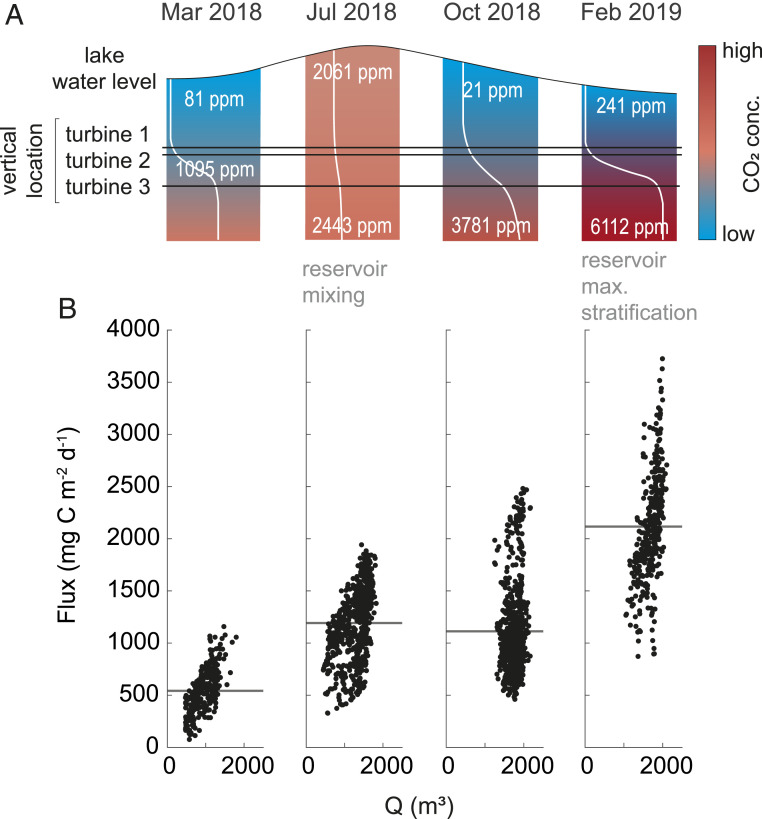
Fig. 2.
Reservoir CO2 concentration in response to stratification dynamics generates seasonal variability of CO2 atmospheric emission from the Zambezi River downstream of the dam wall. (A) Measured epilimnetic and hypolimnetic (or metalimnetic for March 2018) concentration of CO2 in the water column of Lake Kariba just behind the dam on 18 March 2018, 9 July 2018 (lake mixing), 30 October 2018, and 16 February 2019 (maximum stratification of Lake Kariba) together with the water level in the reservoir and the relative depth of the intake of the three turbines. (B) Calculated degassing flux from the Zambezi River 3 km downstream of Kariba Dam (see Materials and Methods and SI Appendix) as a function of water discharge (Q) during the same four months. Gray lines indicate the monthly mean CO2 flux.

