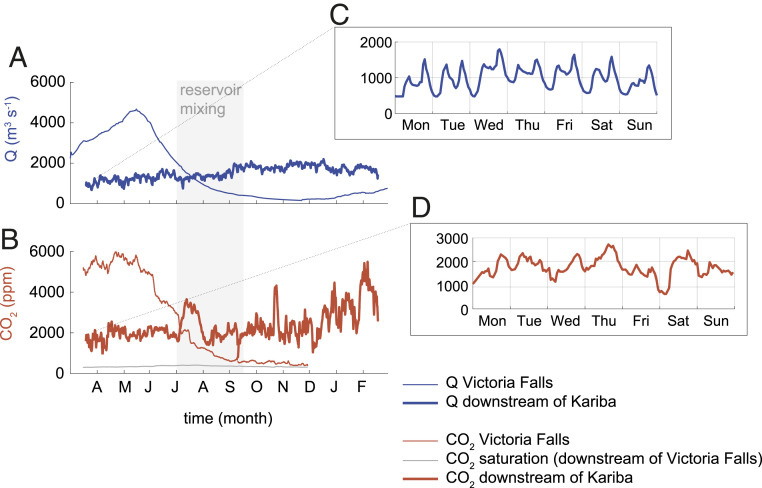
Fig. 3.
Altered seasonality and enhanced subdaily fluctuations of water discharge (Q) and CO2 concentration in the Zambezi River 3 km downstream of Kariba Dam. Yearly signal (A and B) (smoothed with time window of 24 h) and hourly fluctuations (C and D) of reconstructed water discharge (A and C) and calculated CO2 concentration (B and D) in the Zambezi River 3 km downstream of Kariba Dam (thick lines) and upstream of the Victoria Falls (thin lines). See Materials and Methods and SI Appendix for calculation details.

