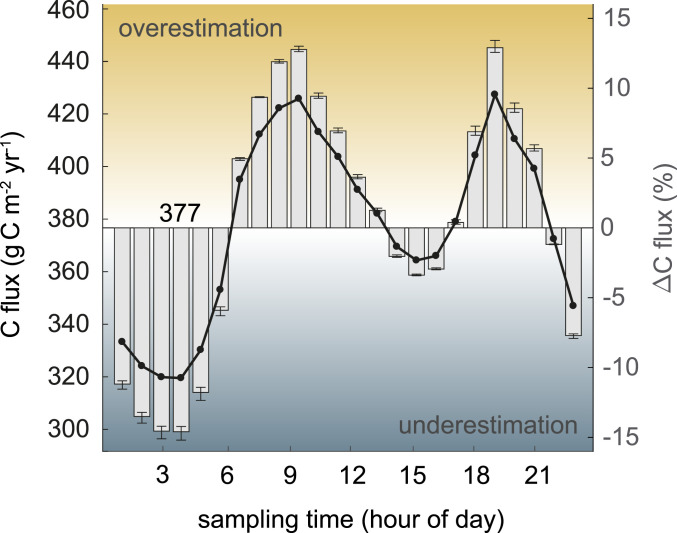
Fig. 5.
Error in the calculation of the annual atmospheric CO2 emission downstream of the Kariba Dam generated by ignoring carbopeaking. Yearly CO2 emission flux downstream of Kariba Dam calculated using the hourly time series (horizontal line, 377 g Cmy) and the same flux calculated just using measurements at a certain time of the day indicated in the abscissa (black line). The bar plot shows the relative difference (in percentage) between the yearly flux estimated by using measurements at a certain hour of the day and the total integral of the hourly CO2 atmospheric emission. Error bars show the difference between the three different models used to calculate the CO2 atmospheric emission. See Materials and Methods and SI Appendix.

